“The principles of successful stock speculation are based on the supposition that people will continue in the future to make the mistakes that they have in the past.” Edwin Lefevre
On Friday a weaker than expected jobs report and downward revisions, new tariffs by President Trump and the U.S. sending two nuclear subs toward Russia slammed markets.
America’s victory over several trading partners may have been a source of feel good for the momentum market but it may also just have marked a hubris high masking a distraction from serious economic problems that could collapse the market faster than the vast majority of market participants believe is possible.
Speaking of government data showing no inflation— affordability is sinking the middle class.
It can cost $400 to take a family to a ball game.
You need to get a mortgage to take a family to Disneyland.
Inflation may be the least of our problems with the market priced for perfection
Reports show that the SPX forward P/E ratio is currently around 24X next years earnings, substantially higher that the historical average of 14-16X since the 1870’s This suggests the market is price for high growth expectations indicating overvaluation relative to historical norms.
The Buffett Indicator (total market cap to GDP) is at 213% significantly above its historical median of 80%.
At 213% the market surpasses the peak of 153% during the dot-com bubble in 2000.
The point is that markets can stay overvalued and overbought for some time. These are not timing indicators—but as W.D. Gann stated the trend turns when Time is up.
Markets can stay overvalued and overbought technically for a long time.
So long that players become frog-boiled to these statistics.
This is why cycle analysis is going to be so critical as this Super Cycle of 90 years culminates.
Throughout 2025 we have been highlighting the symmetry with 1929.
This week we noticed that 642 (6420) aligns with September 3, the top day in 1929.
Last Monday we wrote:
“641 (6410) is opposite the week of the low in early March 2009.
It conjuncts early September the top of the blow off in 1929.
It squares the 666 low from 2009.
Mid-August is interesting as it is 180 degrees opposite the important February 2025 pre-crash high.
As well, mid-August squares 483 (435), the price of the low (in April 2025).”
The SPX’s highest close before last weeks reversal was 6389.67.
Friday’s sharp reversal from a gap to a record intraday-high of 6427 underscores the power of the 6410 square-out with the index closing 99 points off the high and following thru another 101 points on Friday.
On an intraday basis the SPX shed 215 points in two days.
As we forecast
In Tuesday’s report, The Coming Market Crash, we detailed the runaway blow-off of 97 calendar days to the Sept 3 top in 1929 and the 95 day melt-up to the August 25 high in 1987 suggesting Monday’s record high of 6401 in a 112 day run was long in the tooth.
We showcased the deterioration beneath the surface forecasting massive volatility was around the corner.
Wednesday’s article warned that Tuesday’s Key Reversal Day rhymed with the Key Reversal Day from July 11 (7/11) on the one year cycle and the two year cycle from July 2023 when there was a large range Key Reversal on the SPX and not to be surprised if we didn’t get immediate follow thru.
From the July 2024 KRD the SPX pushed to a new high before a Breakaway Gap and a Flash Crash into August 5.
From the July 27, 2023 KRD the market did not make a new high but went sideways for 3 days before embarking on a 500 point decline into October.
Likewise, the SPX pushed to a new record high on Thursday before cracking wide open.
If the one year and two cycles are exerting their downside influence, the down door is open this week.
Will we get a multi-week decline or a multi-month decline?
Thursday’s report “Oops, There Goes Gravity” highlighted the Line of Most Resistance in this 6400 region in tandem with the 6410 square-out in the daily SPX shown again below.
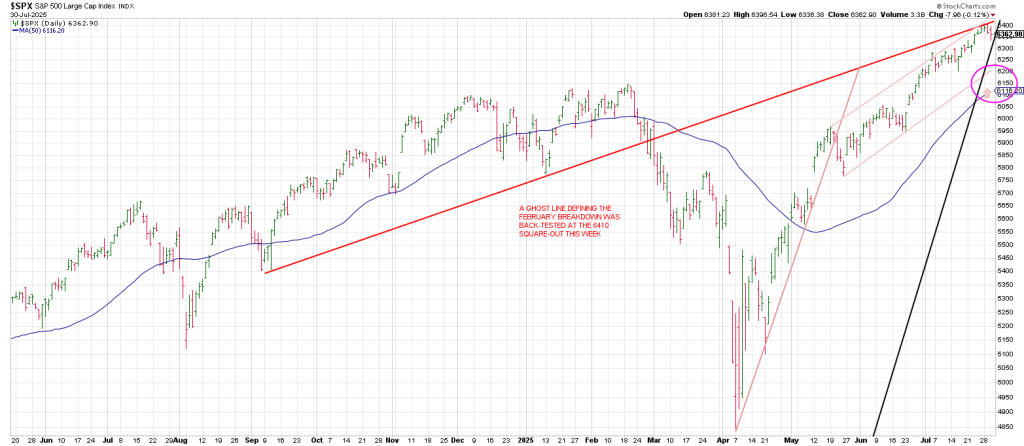
Notice how the SPX dove to the bottom rail of a trend channel from May at the 6200 region.
This ties to the bottom of the vertical trend channel (black), the top rail of which defined the slope of the initial advance off the April low.
The SPX struck 6212 on Friday.
Downside continuation sets up a series of domino’s.
1) Breakage below both channels and the 6200 level which is the last swing low opens the door to
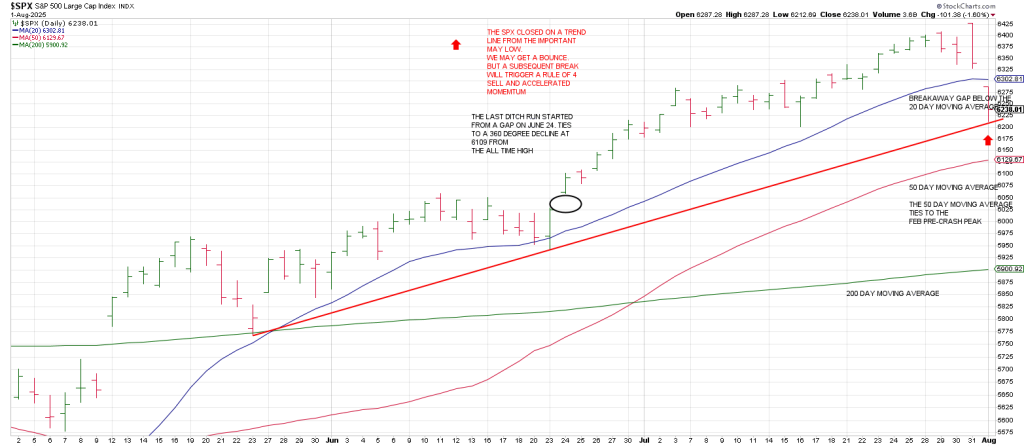
2) The 50 day line at 6129
3) Importantly the 50 day moving average ties to the Feb 2025 high of 6147. So this is the key downside pivot. Prior resistance “should” act as new support—if not, we could get accelerated momentum to the downside.
4) Below the Feb high and the 50 DMA, there is an open gap from May 24th at the 6050 region. Offsetting that open gap triggers a Jump the Creek continuation sell signal
5) Which opens the door to the 200 day moving average at 5900.
A cube-out from the high (540 degrees down) is 5953.
Consequently, I would not underestimate last weeks Key Reversal WEEK.
The last Key Reversal Week on the SPX was mid-July 2024. A Flash Crash of 550 points over 3 weeks.
A Key Reversal Week prior to that occurred in early January 2022 kicking off a 9 month bear market during which the SPX shed 912 SPX points.
Friday morning’s article, Elvis Has Left the Building, noted how many momentum leaders left large signal bar reversals on Thursday. The generals were fleeing the battlefield with arrows in their backs.
MSFT opened on its high and closed on its low on massive volume.
CRDO left a massive Gilligan’s Island…a gap up to a new 60 day high with a close at/near session lows.
Ditto RBLX,ORCL, SNOW and MDB to mention a few.
MDB was a Hit and Run short idea for Friday.
All followed thru to the downside on Friday.
I went on to say that if the SPX 3 Day Chart that turned down on Thursday did not define a low, it would be a conspicuous change in character opening the door to a quick drop to test the February 2025 top at 6147.
Allow me to explain. The 3 Day Chart turns down on 3 consecutive lower lows (lower lows not necessarily lower closes). A turn down in the 3 Day Chart will define a low soon in terms of time and price in a continuing uptrend in keeping with my Swing Method.
Each time the SPX 3 Day Chart turned down since it turned up on April 24th following the April 7 low has defined a low:
May 7
May 23
June 20
You can’t make this stuff up.
Markets play out in three’s in more ways than one.
On Thursday the SPX turned its 3 Day Chart down and the response was a resoundingly bearish result: a Breakaway Gap and Go.
This is the power of my 3 Day, Week and Monthly Swing Method.
The last time the 3 Week Chart turned down was on the week of March 10th. It produced 2 weekly higher highs for a Minus One/Plus Two weekly sell setup (the 3 Week Chart was pointing down for a Minus One while the 2 consecutive higher weekly highs satisfied the Minus Two part of my strategy).
When the SPX snapped the 3 Week Chart low from the week of March 10 late that month, the market dived.
There is a strong likelihood the 3 Week Chart turns down this summer.
The last time the SPX 3 Month Chart turned down was in October 2023 marking a major low at 4103.78.
It is overdue.
The behavior of the 3 Week Chart will telegraph when to expect that to play out.
In sum, the SPX closed on a trend line from the important May 23 low on Friday.
Very short term the market is oversold.
A bounce would not be surprising especially as the powers that be have fought the back the threat of a Black and Blue Friday/Monday since October 1987.
However, notably the QQQ snapped a rising 3 point trend line triggering a Rule of 4 Sell signal.
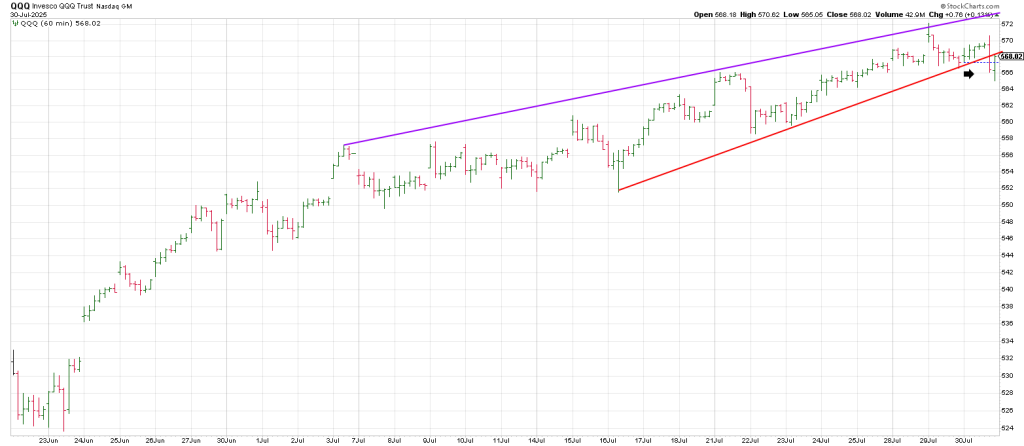
Consequently, it would not be surprising to see an oversold bounce.
That said, on Friday on the Hit and Run Private Twitter Feed after the lows were struck, we suggested a Snapback to 6266 could play out before another rollover.
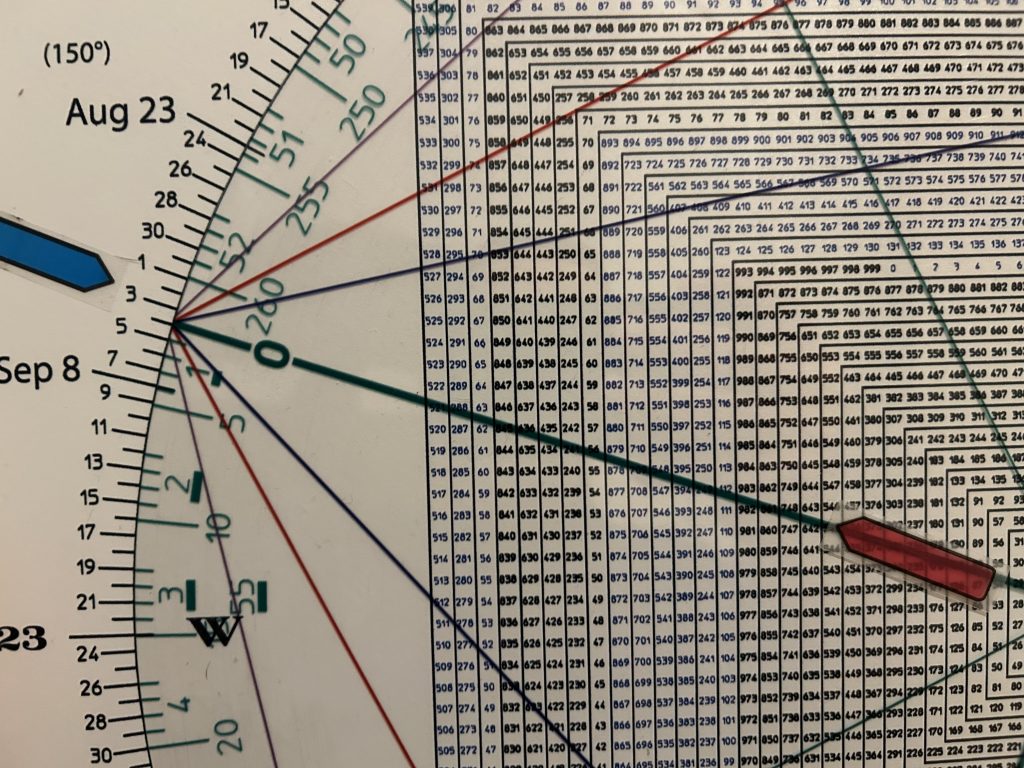
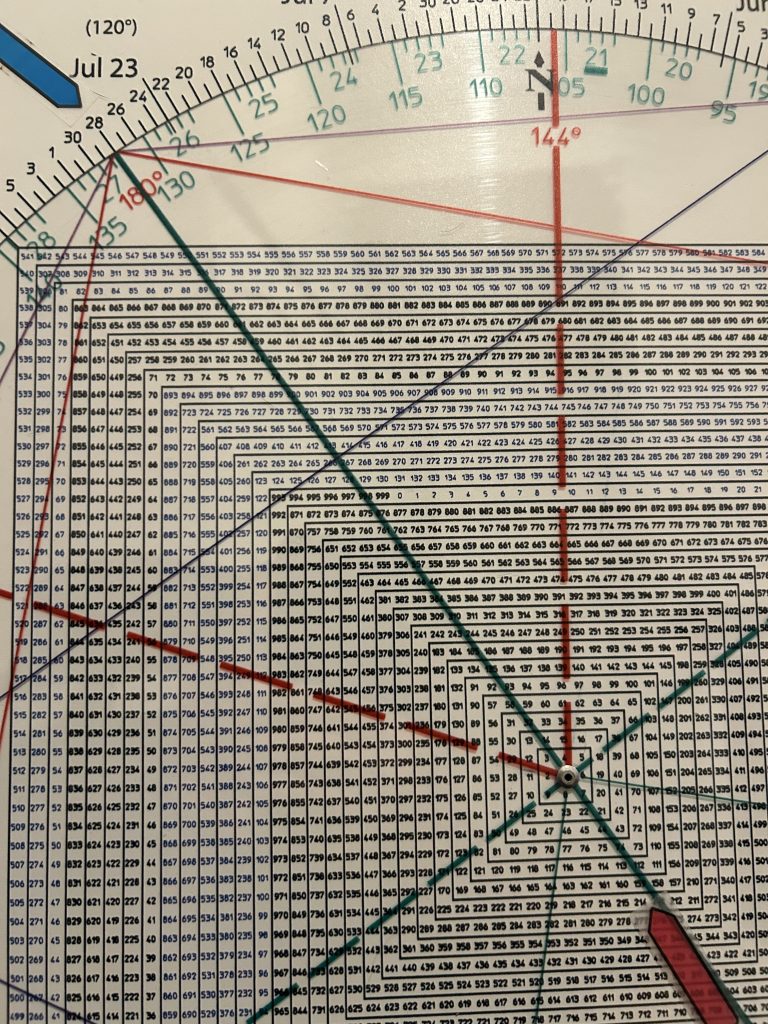
This call was based on the Square of 9 Wheel and the Principle of Squares.
The SPX retraced to 6268 before diving to a new low on the session.
The SPX soared 1592 points from the April 7 low to the July 31st all-time high.
Maybe something, maybe nothing but 159 is 180 degrees straight across and opposite July 28 on the Square of 9 Wheel… July 29 is the closing high on the SPX prior to the last weeks air-pocket.
In other works the melt-up squared-out with the date of the closing high.
Based on the futures action on Sunday night, we are getting a bounce.
It is worth noting that bonafide reversals by definition after large sell days typically comes from a down open, not an up open.
My expectation based on my cycle work, the expectation is for continued massive volatility this week.
Tomorrows report will delve into the current structure of the market and why 2025 is a generational top.

Square of 9 Wheel
Purchase your own Square of 9 Wheel. Shipping to US only. Contact Jeff for shipping outside the US.