“You’ve got me rockin’ and a rollin’, rockin’ and a reelin’” Barbara Ann, The Beach Boys
“About the only advantage of being old in this business is that you have seen a lot of markets, and sometimes market patterns recur that you believe you have seen before.” Bill Miller
“Stocks opened strong on Wednesday notching a new high for the move since the April 7 low, but in the afternoon in keeping with the projection given by our daily Roadmap, the market faltered.
The SPX came within two points of producing a Key Reversal Day sell signal.
Wednesday morning I created a SPX daily which shows the strong open Pinocchio’d the top of an Ending Diagonal or Rising Wedge flagged earlier this week…by the close the index was back within the boundaries of the Rising Wedge and flirting with breakage below support.”
The above is from Thursday morning’s Hit and Run Report.
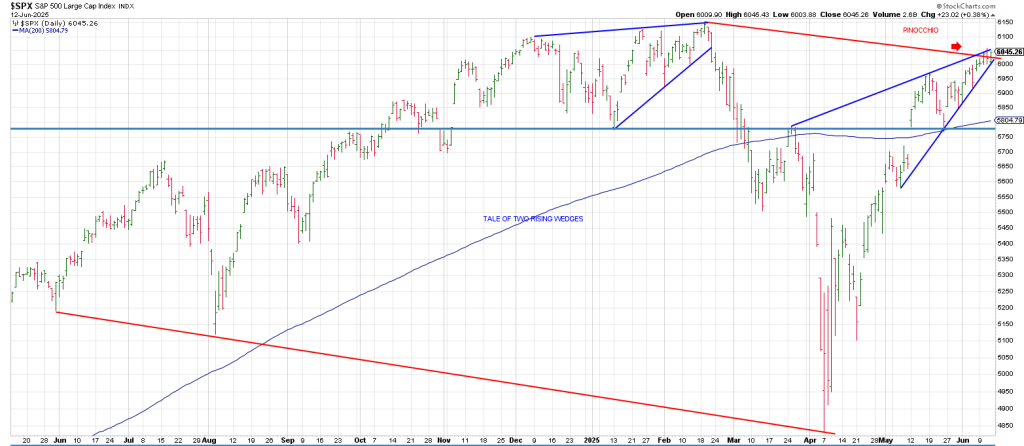
Thursday seemed to shrug off Wednesday’s reversal pushing to a new closing high for the move.
It was frustrating action but we reminded subscribers that there was a strong likelihood that “the second mouse would get the cheese and that breaks below Rising Wedges are dramatic to the downside.”
From the beginning of the month we flagged two major “natural’ Gann Cycles that were blaring warning sirens for mid-June stating “the sky is prepping fireworks.”
We warned, “it would not be surprising if a Black Swan is waiting in the wings in Wednesday mornings report.”
Thursday night Israel bomb bomb bomb bomb bombs Iran.
Is it possible the Iranian regime unleashes sleeper sells in the U.S.?
Underscoring these natural cycles is a Time/Price square-out noted earlier this week.
Allow me to explain.
This week is opposite 614/615 on the Square of 9 Time/Price Calculator.
614/615 is 6147 the Feb 19th all-time high.
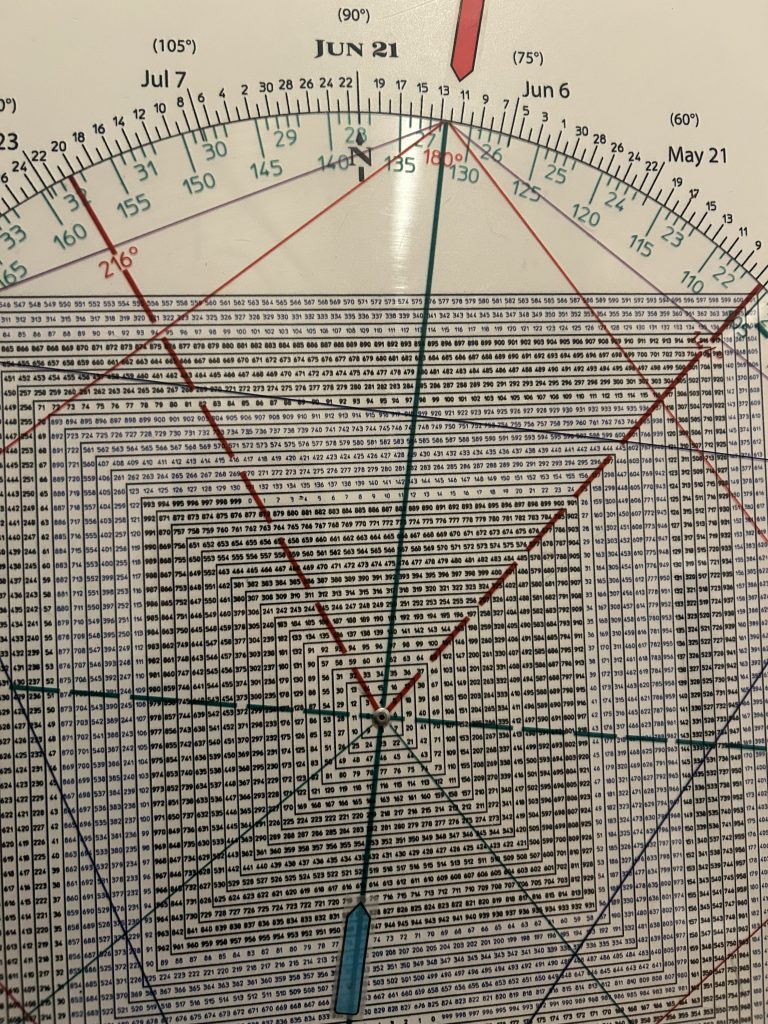
Red is June 12, 2025 blue is 615 for 6150
As the trading seer W. D. Gann wrote, “All important highs and lows are time/price square-outs.”
Time points to Price, Price points to Time.
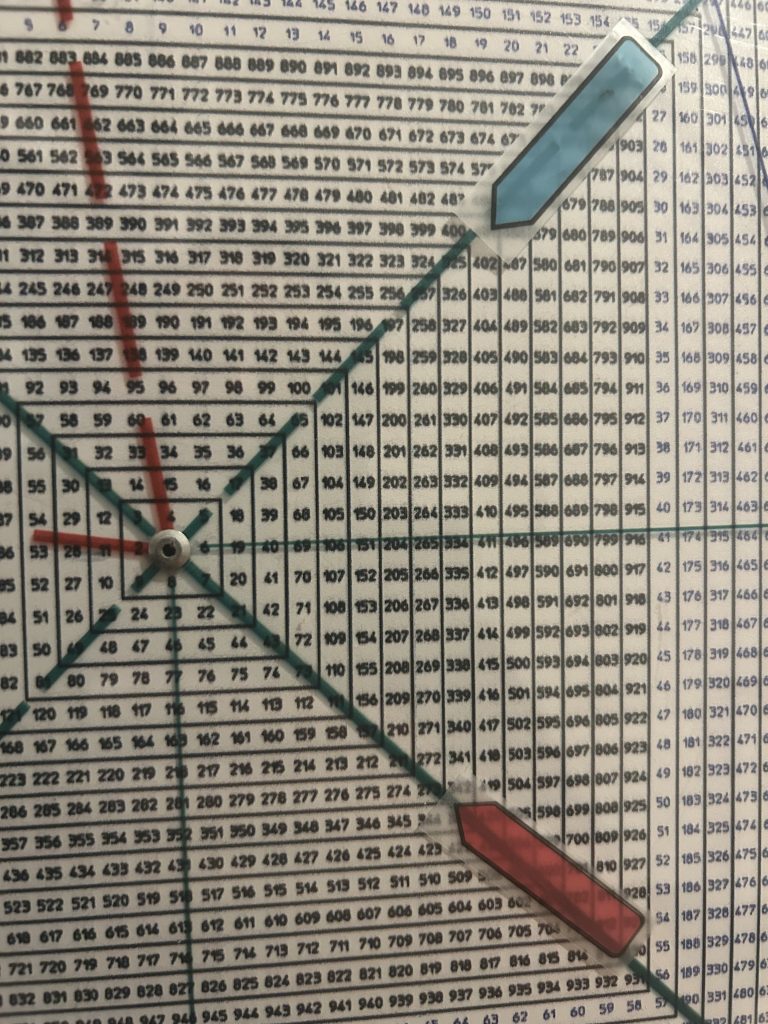
Below is a picture of my Square of 9 Wheel of Time & Price
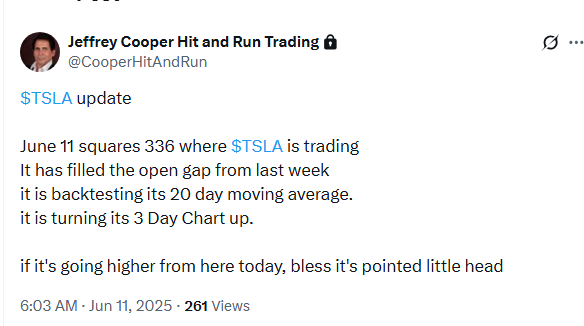
Another example of the amazing calls the ‘Wheel’ makes daily is the recent action in TSLA.
Let’s recap.
TSLA crashed from 368 on May 29 to 273 on June 5th.
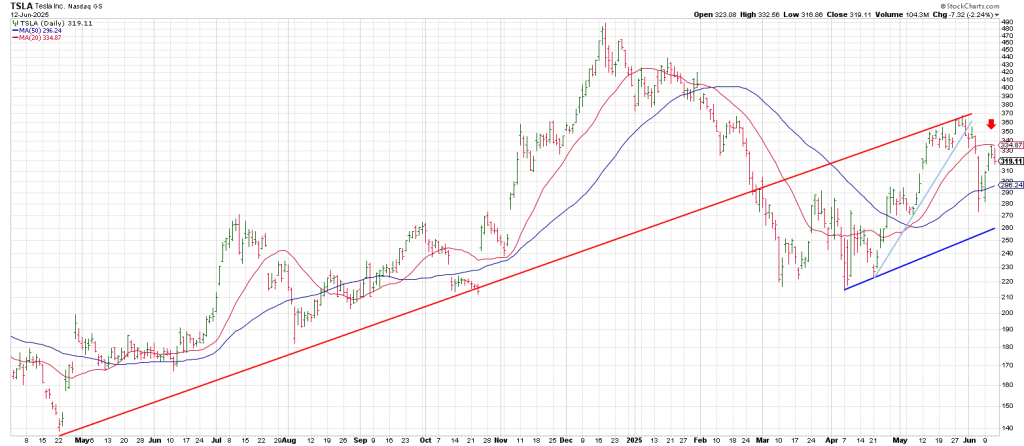
TSLA left a Large Range Outside UP Day (LROD) signal reversal bar on June 9th and Hit and Run
Went long looking for 325 which squares-out the June 5th 273 low.
Members locked in gains.
While TSLA pushed higher on Wednesday we alerted:
In sum, Wednesday the SPX put in a reversal bar but never followed thru on the threat of breaking the Rising Wedge. Instead the index pushed higher but in so doing produced a Pivot High.
This is a high surrounded by two lower highs.
On Wednesday we warned, “If the SPX opens below 6016-6020, the prior recent swing highs, the expectation is for the SPX to retrace its entire last upswing from 5769 OVER COMING DAYS.
With today’s significant Breakaway Gap, it looks like the second mouse is getting the cheese.
5769 is 275 points from where we closed.
Thursday night as I write the futures are down 100 points.
If we get a Friday/Monday plunge, it is interesting that June 16 “points to” 566 (5660) on the Square of 9 Wheel.
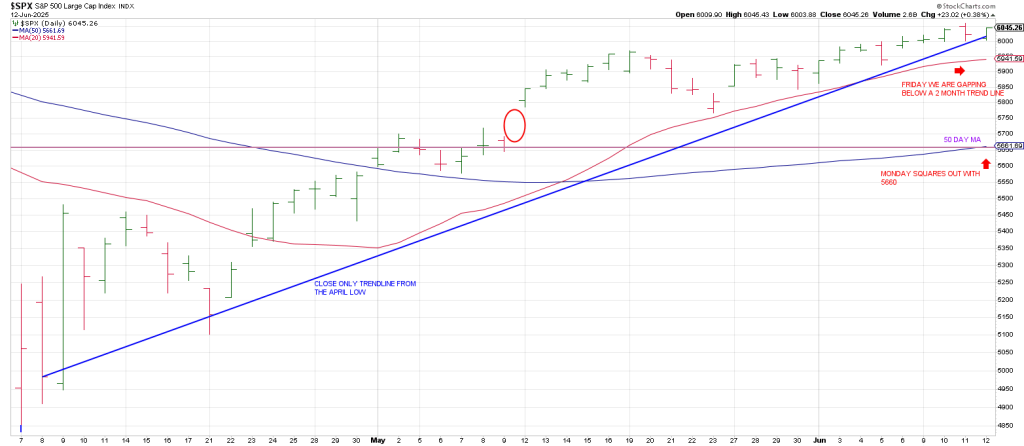
5660 is Phil D Gap from May 5, the day before the SPX had a massive gap up.
That gap ties to the 50 day moving average Bowtie.
There is a strong likelihood breakage below that gap and the moving averages confirms an intermediate top
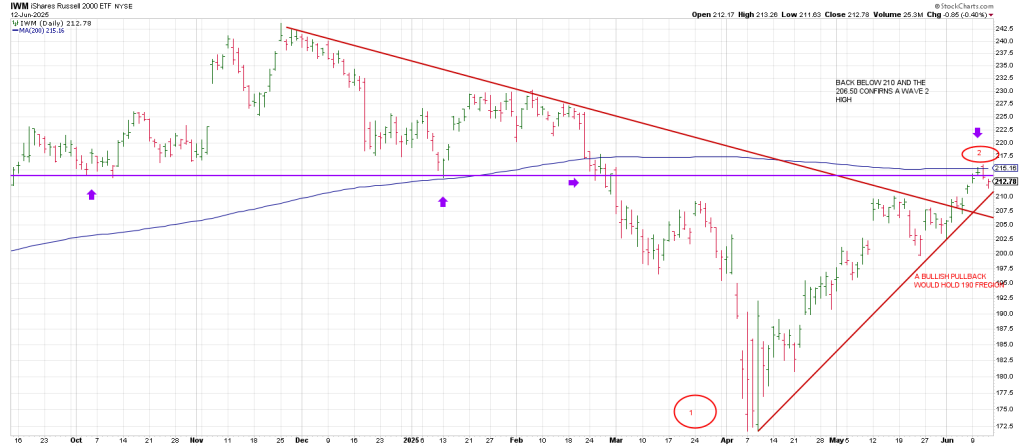
The Truth Teller, IWM, left a Key Reversal Day on Wednesday from its 0verhead 200 day moving average.
There is a strong likelihood that the reversal marked a Wave 2 corrective high with the Wave 1 decline playing out From November to April.
With today’s gap down, it looks like the second mouse is getting the cheese.
That’s 275 points from where we closed.
Thursday night as I write the futures are down 100 points.
Monday morning’s newsletter is about what is about to happen in markets for the balance of 2025.