“And when Monday comes ‘round, there’s a high lonesome sound.” King of the High, Roger McGuinn
“The conscious life of the mind is of small importance in comparison with its unconscious life.” Gustave Le Bon, The Crowd
“A successful trader studies human nature.” W D Gann
It is simple to say that societal sentiment drives markets, but it is quite another to measure such extremes in sentiment that mark tops and bottoms.
What if these extremes could be measured in Time and Price that produce repeatable patterns?
Cycles of Time and Cycles of Price moving in patterns.
With over 40 years in the markets, I have proven to my entire satisfaction as well as demonstrated to others that geometry—integrating time and price— determines the precise points at which stocks and commodities rise or fall within a given time.
The working out of this “geometry” or what W D Gann called the Law of Vibration determines the cause and predicts the effect long before the crowd is aware of either.
If it is true that cycles of societal sentiment causes these patterns we see in the market, then it follows that the news breaks with the cycles, and not the other way around.
Friday is a good example of how extremes in markets can be measured.
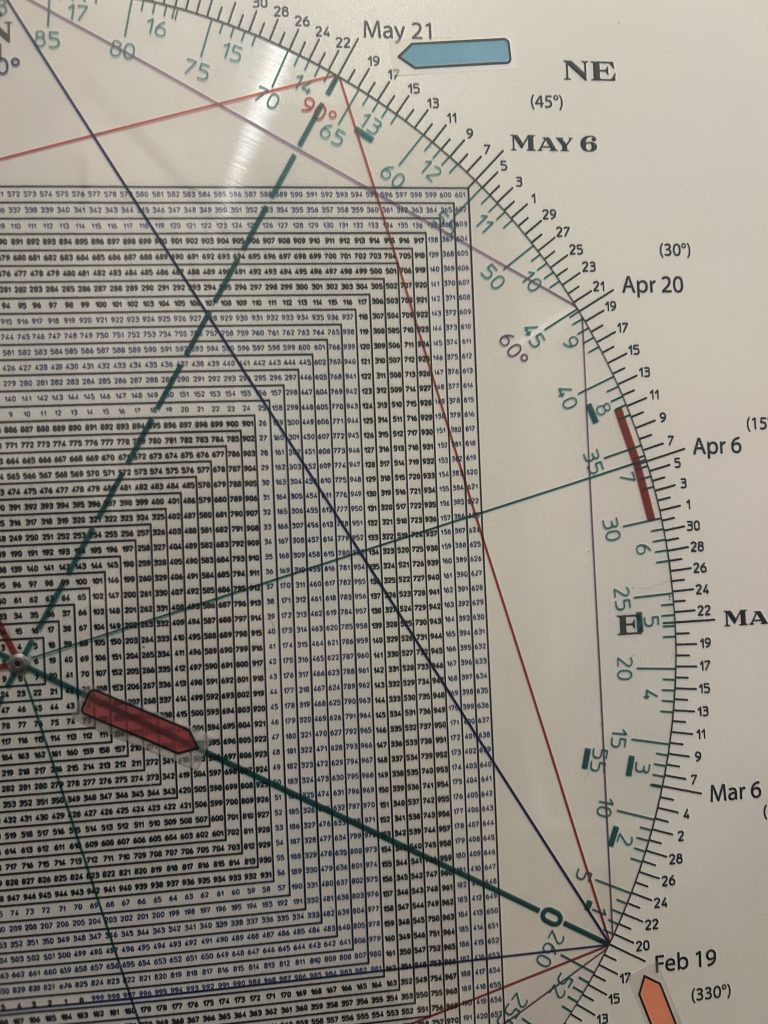
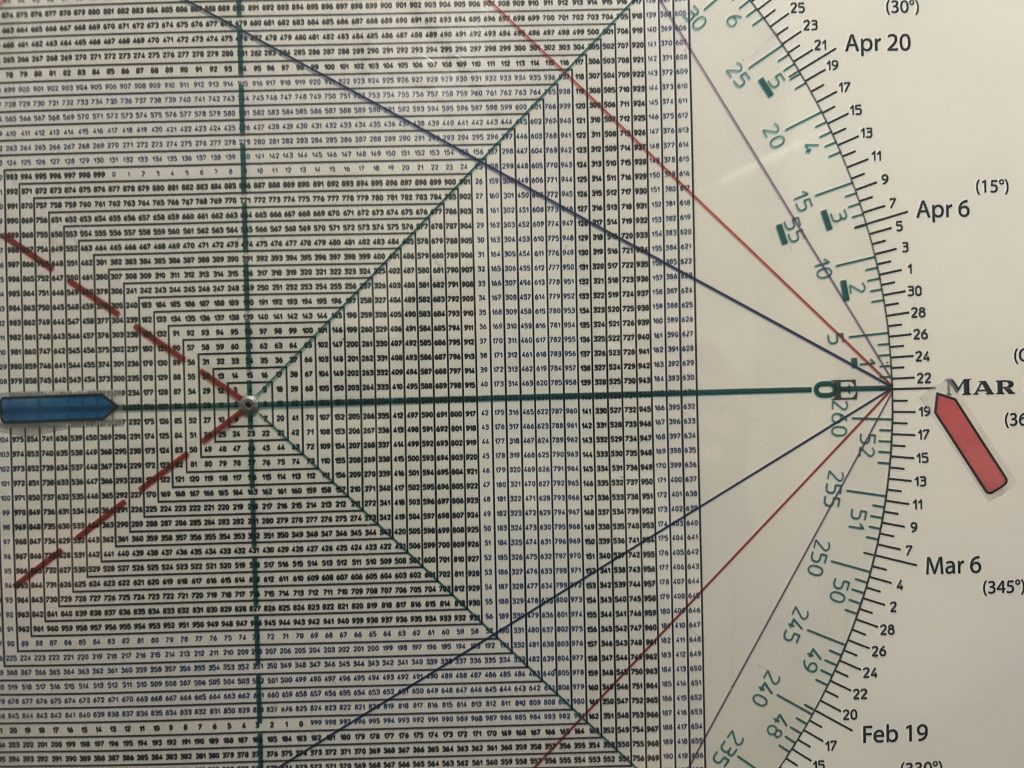
One of the best tools I know of to measure markets on various degrees or fractals of sentiment is what is called the Square of 9 Wheel or Square of 9 Time & Price Calculator pictured below.

Square of 9 Wheel
Purchase your own Square of 9 Wheel. Shipping to US only. Contact Jeff for shipping outside the US.
It is called the “Square of 9” because the first square of the number grid ends with the number 9.
Price then spirals around the grid…as price is not linear but progresses in a logarithmic spiral.
How does it play into the current market?
“We had a 7 week Selling Panic that ran a tad shy of Gann’s full 49-55 day Panic Window if you count from Feb 19th.
Remarkably the Selling Panic has been followed by a Buying Panic.
Next week is week 7 and 5 Waves up can be seen.
The question is whether this is an initial 5 waves up in a larger pattern (higher) or 5 Waves of a bearish B Wave. That question will be answered by the nature of the next pullback.”
The above is from Friday morning’s report.
Friday on the Hit and Run Private Twitter Feed we flagged that 596 (5960) squares February 19th, the all-time high for a possible Time/Price square-out.
Time points to price, price points to time.
As well since May 16/May 19th is 90 degrees/days from the Feb 19 high we have a potential “double square-out”.
You see, May 16-19 also squares-out with 5960.
In my experience when an item runs hard into a possible Time/Price square-out (versus walking into it), price ricochets hard.
Think of running into a brick wall and being thrown back versus walking into a brick wall.
Monday a week ago we stated that “ the NYSE celebrates its birthday on May 17th and natural cycles suggest it will provide shocks and surprises.”
It is the 233 anniversary of the NYSE.
233 aligns with March 21st, W.D. Gann’s Zero Point, the Spring Equinox, the natural beginning of the year.
Since 233 falls on what is called the Cardinal Cross, it “exalts” this anniversary—it makes it more dramatic/powerful.
We are also at the 17th anniversary of the high prior to the Lehman Crash in 2008.
Tomorrow’s report will walk thru the historic significance of this cycle.
After the Friday’s close the Moody’s lowered the U.S credit rating and the market tanked after hours from a high tick close…mirroring the high tick close at the February 19 all-time high.
Was Friday a Secondary High prior to a vicious leg down?
Alternatively, will we see a deep pullback that carves out a buying opportunity?
Let’s look at the levels to watch counting up from the 4835 low:
The first cube up of 540 degrees (a true square) is 5260.
Remarkably 5260 ties to the high the April 7 low/reversal day.
The second cube up is 5704.
This ties to the May 2nd high—the high of high level consolidation prior to the May 12th “Let’s Make A Deal” explosive gap.
The third cube up 6167, a fraction from the Feb 19 6147 all-time high.
The math proves the pudding.
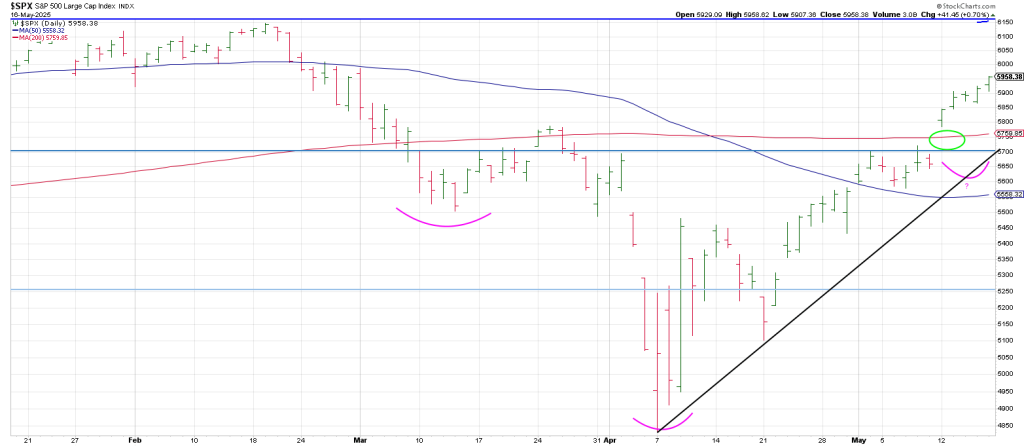
A pullback to “cube 2” at the 5704 region satisfies Phil D Gap and a backtest of the 200 day moving average.
Theoretically a pullback that holds above the 50 day moving average could install an inverse Right Shoulder.
That’s the bull case; however, an impulsive 5 wave decline argues that a leg to new lows below the April low, is on the table.
In either instance, my expectation is for massive volatility this week as the bull and bears go to battle.
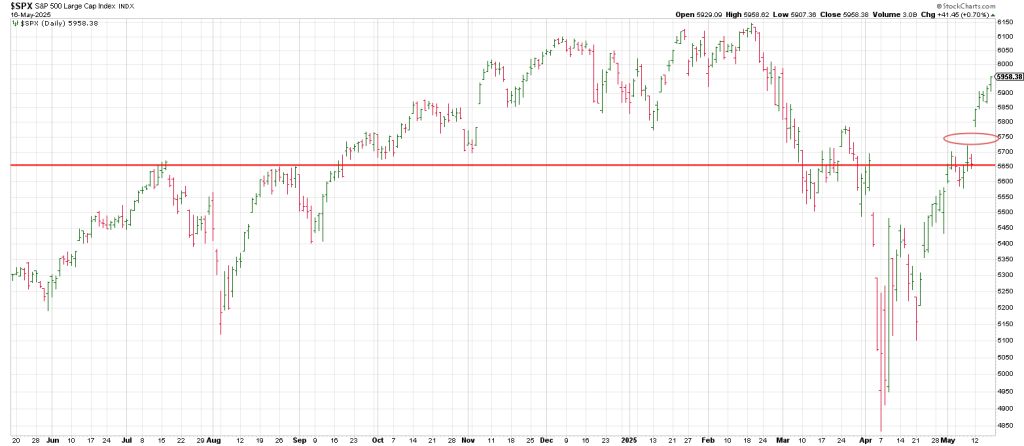
The SPX may drop back to the Maginot Line this week—the 5650 region which is the summer highs from 2024, which breakage below signaled a waterfall decline.
Notice that the first drop below this 5650 Maginot Line produced a rebound while the second mouse got the cheese…the second drop below 5650 perpetuated a Flash Crash.