“I’m here to tell ya that I’m bad to the bone.” Bad To the Bone, George Thorogood & The Destroyers
“When Time and Price square-out expect a change in trend.” W. D. Gann
“We must remember that delusions swing between extremes, like pendulums. Delusions of grandeur and unending wealth give place to delusions of unending gloom. One is as unreal as the other.” Bernard Baruch
Going into early April we shared with subscribers that the October 2022 low of 349 squares-out with April 7th.
The first week of April was 7 weeks from the Mid-February Signal Bar Reversal Week.
7 weeks is the Gann Panic Cycle.
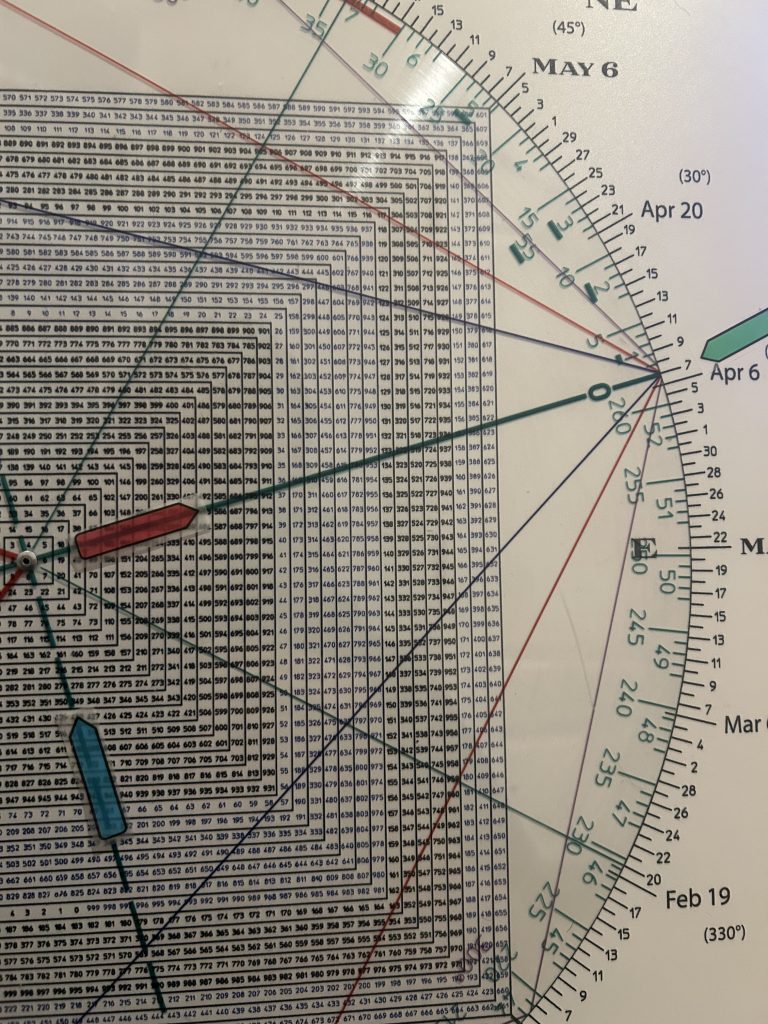
The Square of 9 Wheel image below shows that 349 squares-out with April 7.
On Tuesday, May 13, the SPY closed 586.
On the Sq of 9 image above green points to April 7th.
Blue points to 349, the Oct 2022 low.
Red points to 586,
586 may be a high of some degree.
349 squares April 7.
The price of the Bear market low squares April 7, 2025 crash low.
586 vectors April 7 as well.
There is a strong likelihood that the time of the crash low, April 7, points to the price high.
Time points to Price, Price points to Time
The amazing geometry of the Square of 9 Wheel is that it integrates Time and Price.
The Square of 9 Wheel is the bad-ass trading tool.
Next week will be the 7th week off the low (including the major reversal rally week of the low itself).
We saw a Selling Panic end on week 7.
We have seen a Buying Panic that may turn down on the 7th week from low.
That said, while often times bottoms are V formations while tops trace out a pattern high.
In other words, they find a high, pullback, and test the high.
Given that the SPY closed at 586 for a possible Time/Price square-out yesterday, we may pullback and then test this level before rolling over in earnest if that is the agenda.
The following weekly SPX shows two trend channels.
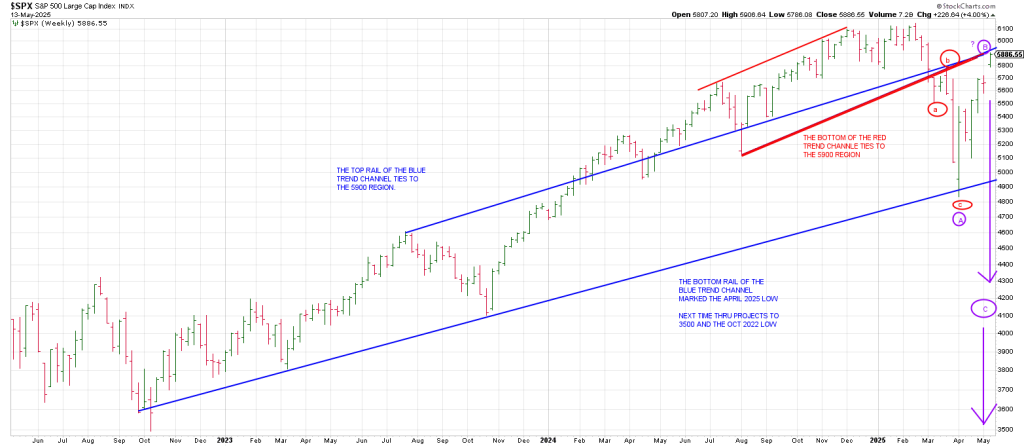
The red channel was produced by paralleling a Bottoms Line from the tops from the August 2024 Air Pocket Low.
The larger blue trend channel was created by connecting the closing low in September 2022 with the March 2023 low and the major Oct 2023 low.
Notice that it acted as support on April 7 2025.
The top rail of the blue trend channel parallels the Bottoms Line starting from the important July 2023 peak.
The important thing to notice is that they intersect at the upper 5800 region this week.
The structure of the decline since the Feb high must be an A B C decline. You cannot count 5 waves down.
It looks like a clean a b c decline in red to the April 7 low.
The indication is that the entire decline into April was in turn a large A Wave (purple).
If so then the 1000 point Buying Panic we’ve seen may be a bearish B Wave.
The implication is a bad to the bone decline, a vicious C Wave is around the corner.
Regardless of whether you want to be a bull or a bear here, there is a strong likelihood a sell-off is on deck.
Even in the bull case that sell off could be deep.
In the bear case…well there will be blood.

Square of 9 Wheel
Purchase your own Square of 9 Wheel. Shipping to US only. Contact Jeff for shipping outside the US.
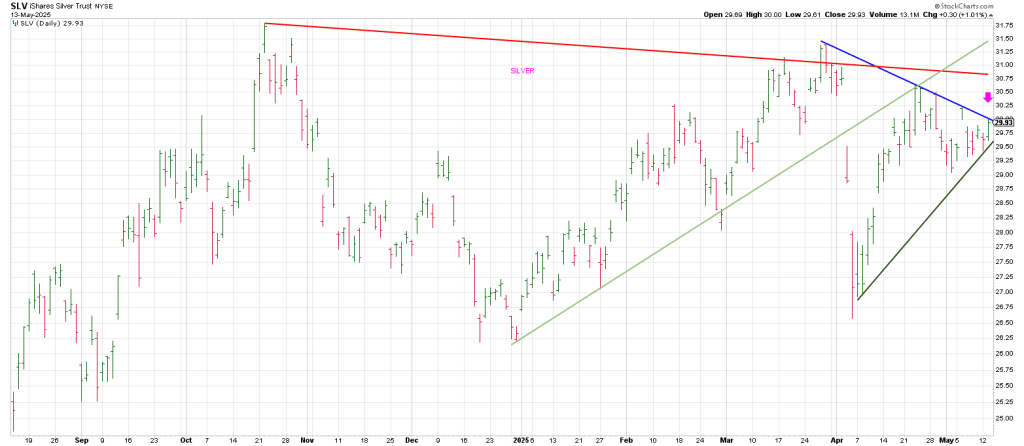
Below is a daily SLV.
This week squares-out with a price of 30.
As you can see SLV will trigger a Rule of 4 Breakout over 30 which in turn may perpetuate a push to 31.
Over 31 opens the door to 32.50.
Over 32.50 opens the door to 39—based on the projections of the Square of 9 in tandem with the pattern presented.