“The fragility of a system increases with its degree of stability.” Nassim Taleb
Markets were buoyed overnight by enthusiasm surrounding the SOTU speech.
The market was spearheaded by a dual-pronged assault by the usual glamour suspects and the software and crypto’s.
LITE, COHR, WDC, TER, VICR and VICR Notably SNDK was red most of Wednesday. Something you don’t see with the SPX up 50 points.
The beat-up names in software and crypto surged.
These include SNOW, ZS, MSFT and MSTR and CRCL.
NVDA the largest cap stock in the world, was basically the last big earnings report until April.
Wednesday was sharply bid up apparently on expectations of a strong report from BVDA.
As expected, NVDA delivered robust revenue and earnings growth, along with solid forward guidance.
The initial reaction was sharply higher.
But in a pattern that has become increasingly familiar, that strength proved fleeting.
After the post-earnings surge, futures reversed and are trading lower overnight.
NVDA spiked above 200 but then closed closer to session lows than highs.
If NVDA can barely go up on a blowout guide, how can people keep on buying LITE, CIEN, GLW and COHR every day at 50 X eps.
Still not a raise to the outlook on NVDA. The CEO had already said at previous outings, he expects to beat the $500 billion outlook. CFO merely repeated that today.
Also the presentation made no mention of the $500 billion number unlike the presentation at the Oct Q earnings.
This is a red flag.
Weak trading after hours implies investors were looking for a quantitative raise of the $500 billion number.
Accordingly we got some after hours weakness in MU.
In sum, NVDA triggered a Rule of 4 Breakout above triple tops but breakage back below will get traders attention.
The downside pivot is around 186, where a rising trendline from the February low kicks in currently. The 50 day moving average residing at 185 currently.
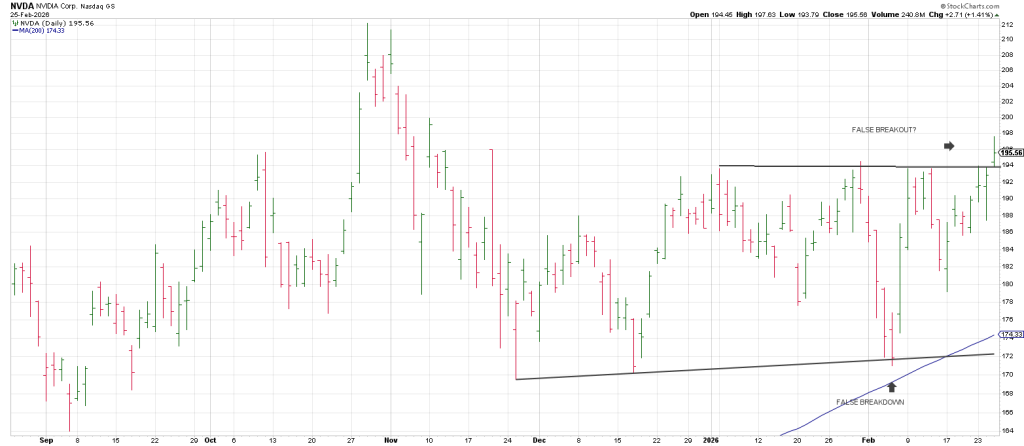
Breakage below the bottom of NVDA’s sideways stint ties to its 200 day moving average.
The 200 dma was tested in early February where the circled 3 Day Chart comes in at 171.03.
Remarkably the recent rally in NVDA to over 200 today has not turned the 3 Day Chart up.
This is because there are not 3 consecutive higher daily highs (not closes…intraday highs).
It just missed doing so on Tuesday.
Bottom line a drop below the aforesaid trendline at 186 ish triggers a Triangle Pendulum sell signal.
Once again we see a market levitated by news rather than supported by broad internal strength.
NYSE breadth was unimpressive with gainers exceeding losers by just 440 issues.—a tepid showing given the magnitude of the index gains.
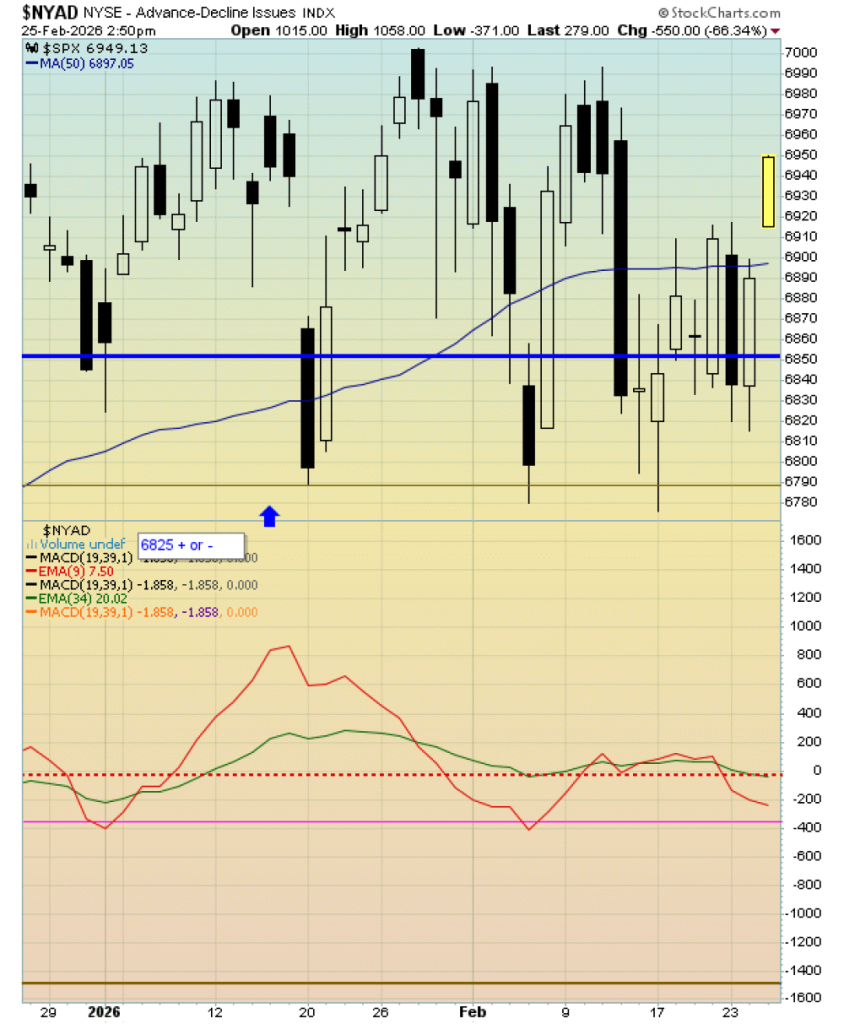
The SPX rallied to a declining Tops Line on Wednesday; however, like NVDA, it has not turned its 3 Day Chart back up.
The SPX 3 Day Chart low is at 6775.50
We know that is also the Maginot Line during this incessant chop for the last 2 months.
Arguably this sideways range has been in progress for 4 months, since late October.
Trade now below the circled 3 Day Chart low not only triggers a Rule of 4 Sell (breakage of triple bottoms) but it violates the 3 Day Chart CIRCLED low which will issue a Time Turn Trend sell signal.
Tomorrow’s report will take a look at another historic 4 month ‘chop’ and what this analogue potentially projects.
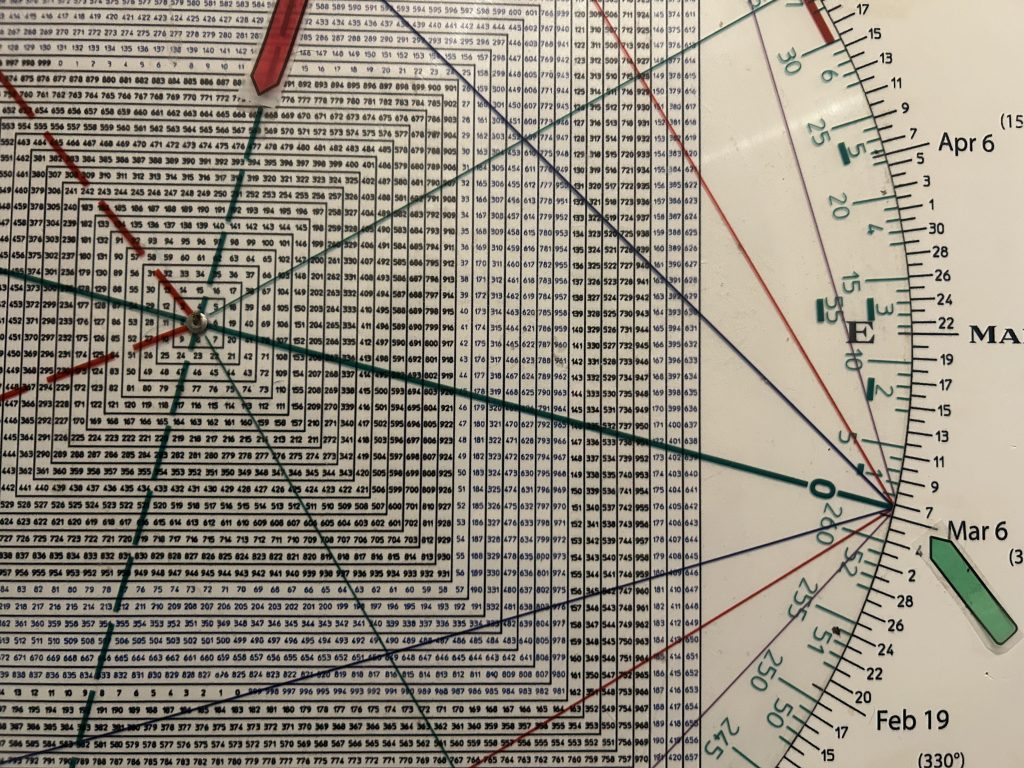
It “should be” easy for the SPY to breakout here; however, yesterday the SPY struck 693 which ties to the important anniversary dates in early March: the 2009 low and the 2000 NAZ top.
So 693 is a strong vibration that could be major resistance.
The corollary to that is breakage through 693 opens the door to 7100 plus.
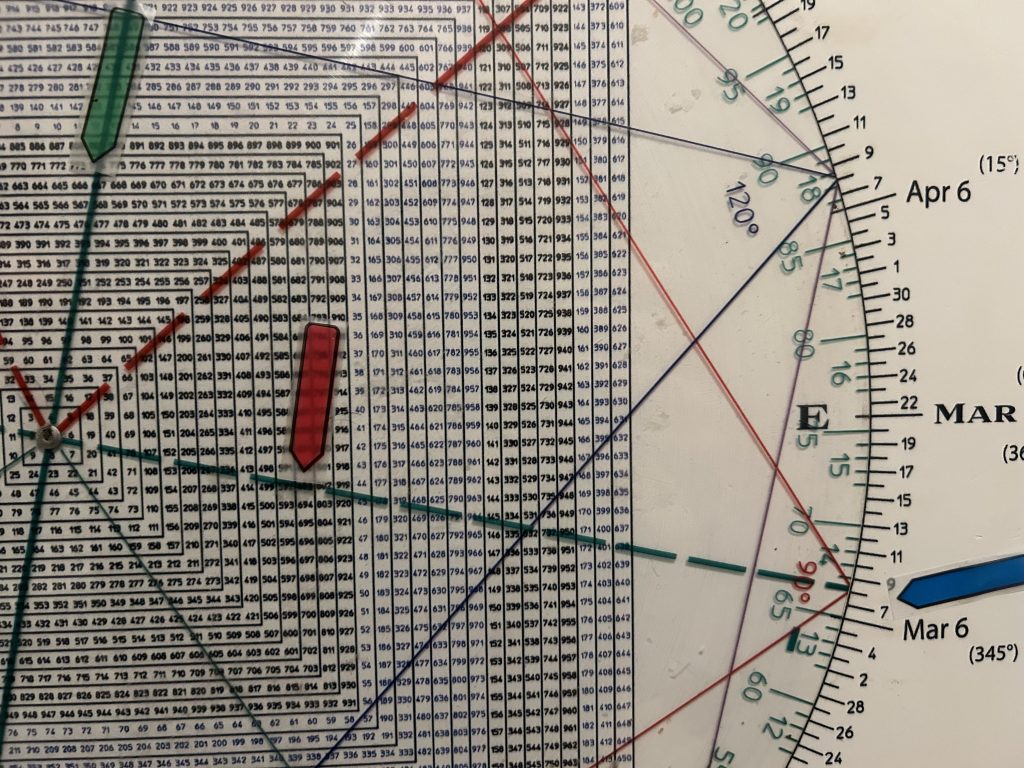
Blue, early March
Red, 693
Green 666
I’m kind of mixing apples and oranges here.
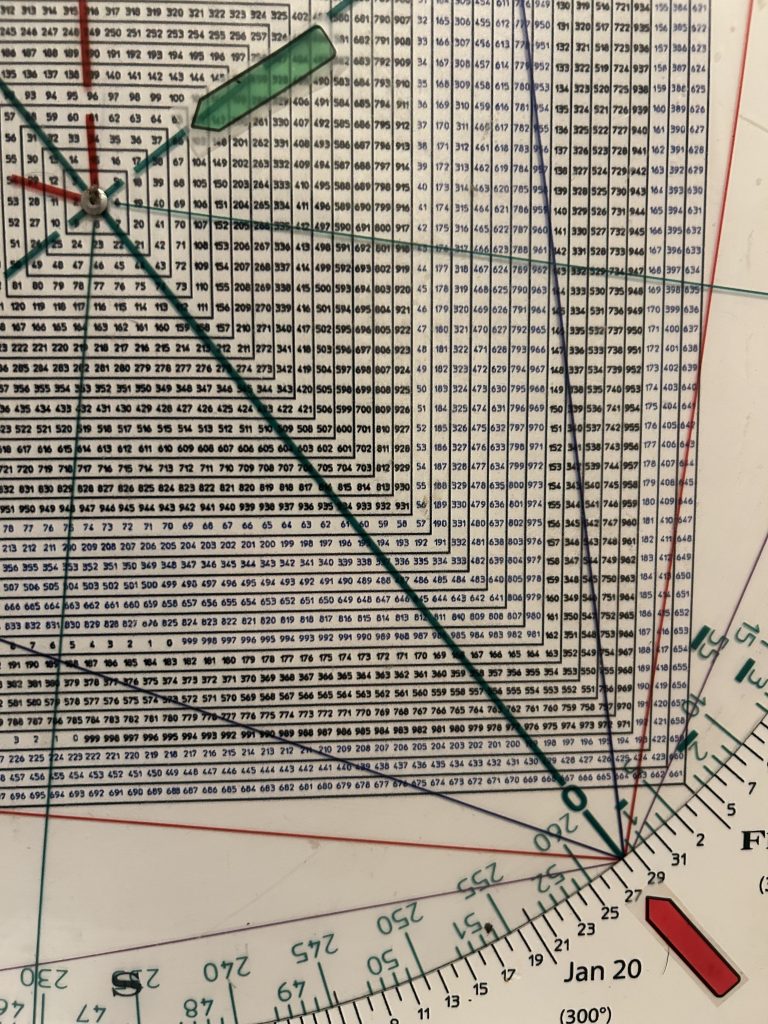
Obviously the SPY low in March 2009 was not 666. Moving the decimal point we get 66.
66 squares Jan 28, the all-time high…so far.
Is the price of the Bear low in 2009 calling the time of the Bull high here in 2026.
If the SPY cannot exceed this level in this cyclical window, I think it reduces the potential for a run to 7100 plus.
Why do I give this idea of a Time/Price square-out such weight?
The 2009 low was a Time/Price square-out with March 6 squaring a price of 666.
The October 13, 2022 bear market low was a Time/Price square-out with October 12 squaring 349 (3490).
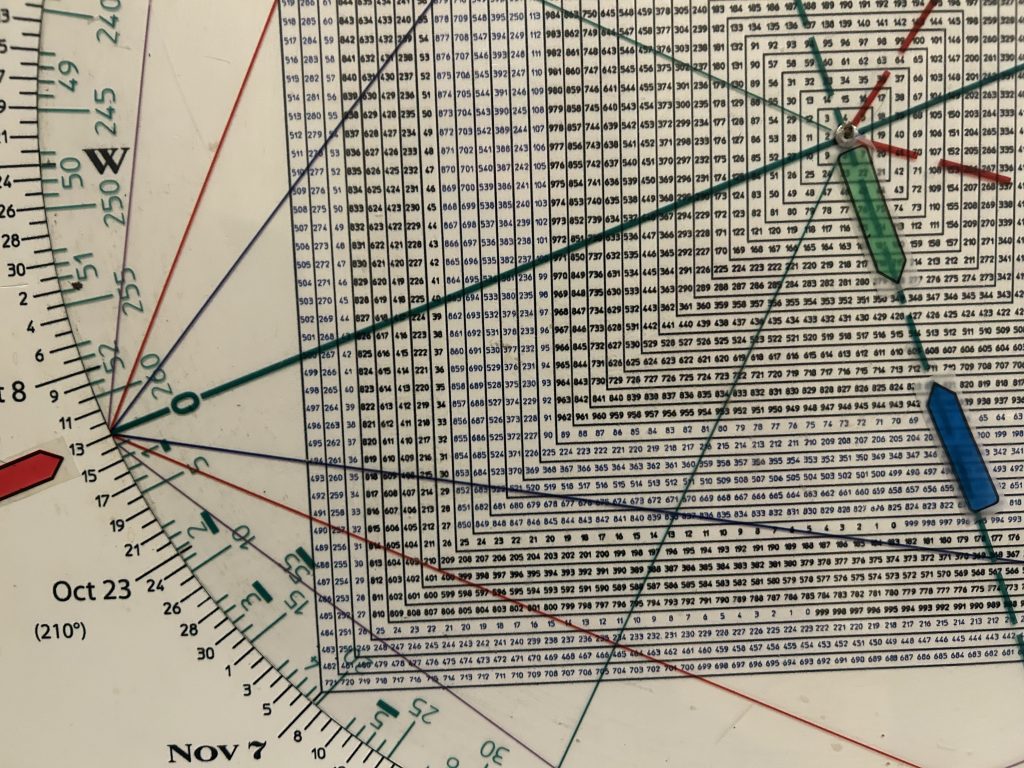
Notice that 4 revs of 360 degrees up from 349 is 711 …there’s the 7100 + I refer to above.
We have a lot of volatility within the context of a contraction in range. This has created complacency.
In sum, the greatest trick of the market ever pulled is to appear stabile just before it goes nuts.