“Well this could be the last time
Maybe the last time
I don’t know.” The Last Time, The Rolling Stones
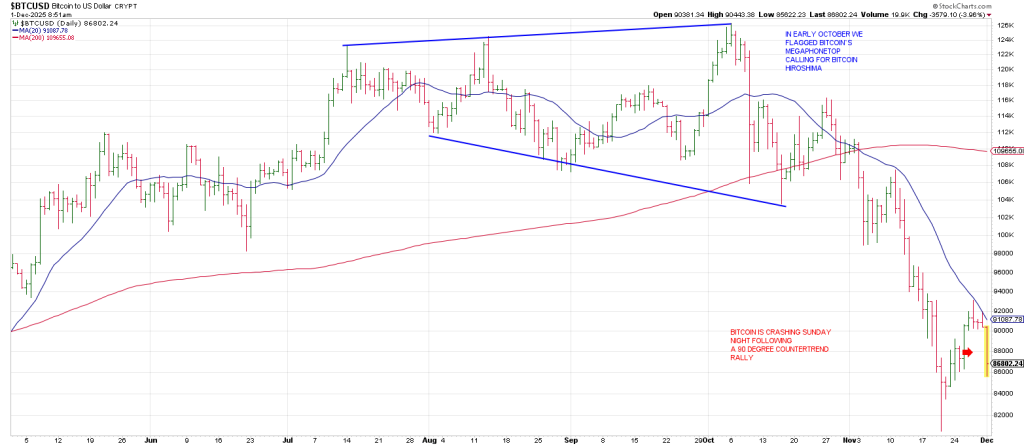
When NVDA announced “terrific” earnings a couple of weeks ago, only to see their shares reverse and dive after a Miss Direction deceptive spike higher, it looked like this was the prick that burst the AI bubble.
It seemed plausible enough given that Wall Street if not the entire investment world were desperately counting on the worlds only $5 trillion company to inject the markets with a shot of momentum.

But instead after plunging for several days after the announcement, stocks caught their footing and rallied sharply.
The SPX is up 329 points in 5 sessions.
The Q’s are up almost 7% in 5 sessions.
Did the 1 day Undercut of the key 6520 SPX level represent the start of leg to a new all-time high
Or is the ferocious rally in keeping with classical bear market rallies and putting in a Secondary Top?
The consensus Friday seems to be that there is no point in pretending the rally is a fake with the average within striking distance of record high.
But isn’t that exactly what a Secondary Top is all about?
The SPX/QQQ high was October 29th.
7 weeks from that high (assuming we do not get a higher high in the interim) ties to the Gann Panic Window.
That starts Dec 7 running to Dec 21.
The rally is not really surprising despite the action in NVDA and other chips like AMD because the QQQ turned it 3 Week Chart down for the first time since the April low. Further it was the first test of the 20 week moving average.
The Q’s rallied then pulled back to test making a higher low, a Secondary Low.
As below so above?
We may be making a Secondary High mirroring the price action at the April low.
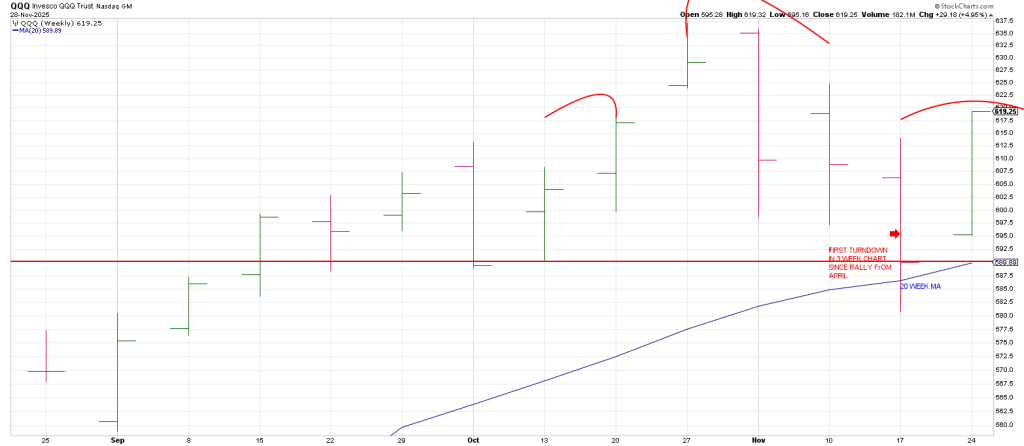
A higher high above last weeks high in the Q’s will put them in the Weekly Minus One/Plus Two Sell position. That isn’t necessary to define a turn.
Breakage below the circled 3 Week and 3 Day Chart lows at 580.74 will be a point of recognition.
Respect it should it occur.
An hourly QQQ from the “low before the low”, the Oct 18 low shows a very well-defined Rising Wedge.
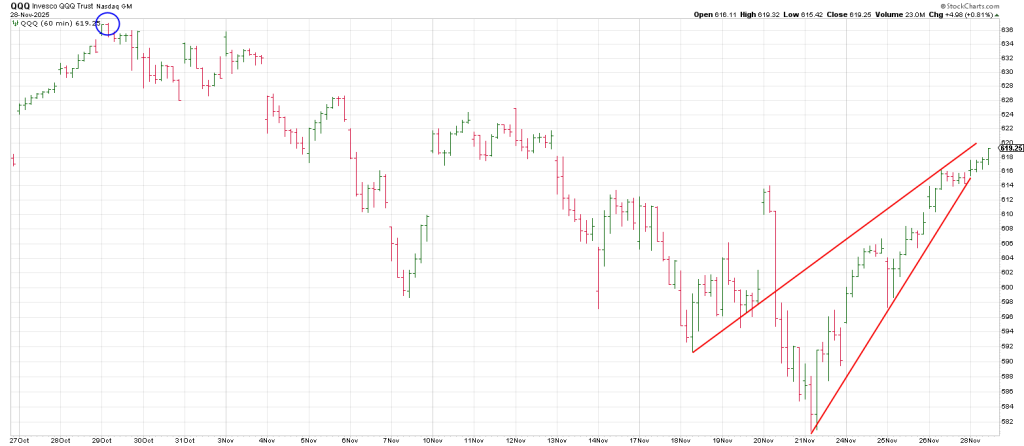
Breakdowns out of Rising Wedges are typically sharp and swift.
Checking a daily QQQ shows it turned its 3 Day Chart up on Wednesday.
The 3 Day Chart ‘circled’ low is 580.74.
Trade below that triggers a Time Turn Trend sell signal confirming a Secondary High.
As W.D. Gann stated the Secondary Top is the idea place to short.
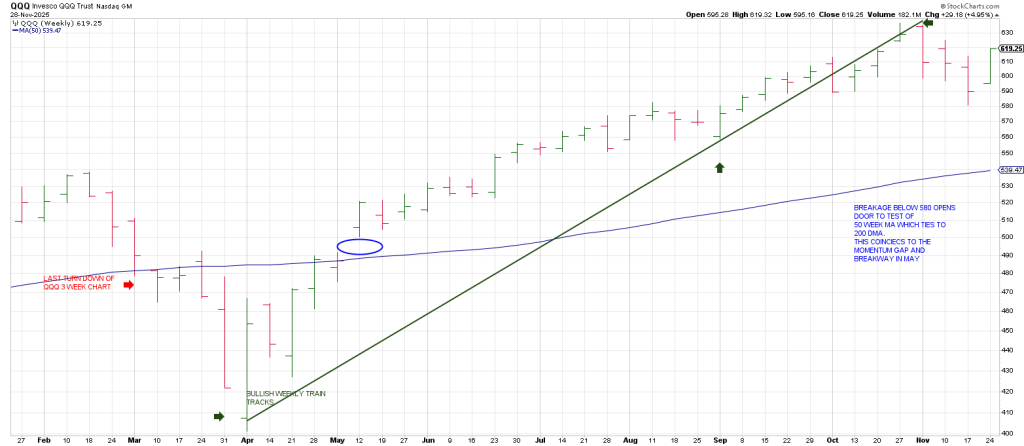
Of course this is the circled 3 WEEK Chart low as well, so a very important level.
Notably when the 3 Week Chart circled low was last violated was in late March.
It was followed by a 50 point or 15% crash.
I say crash because it happened in two weeks.
It culminated a 7 week Gann slide.
The low week left bullish Trail Tracks telegraphing a rally phase that would turn out to be a Runaway Move.
In sum, as offered above, the SPX/QQQ topped on Oct 29 and the Gann Panic Window opens Dec 7 and runs to December 21.
Let’s review the Gann Panic Window and Secondary highs in the historic crash in 1929.
In 1929 the DJIA rallied sharply for 5 days after undercutting the prior swing low.
Similar to the SPX action a week ago.
Currently the SPX ha rallied 4 days with the low day being a gainer so theoretically a 5 day rally ala 1929.
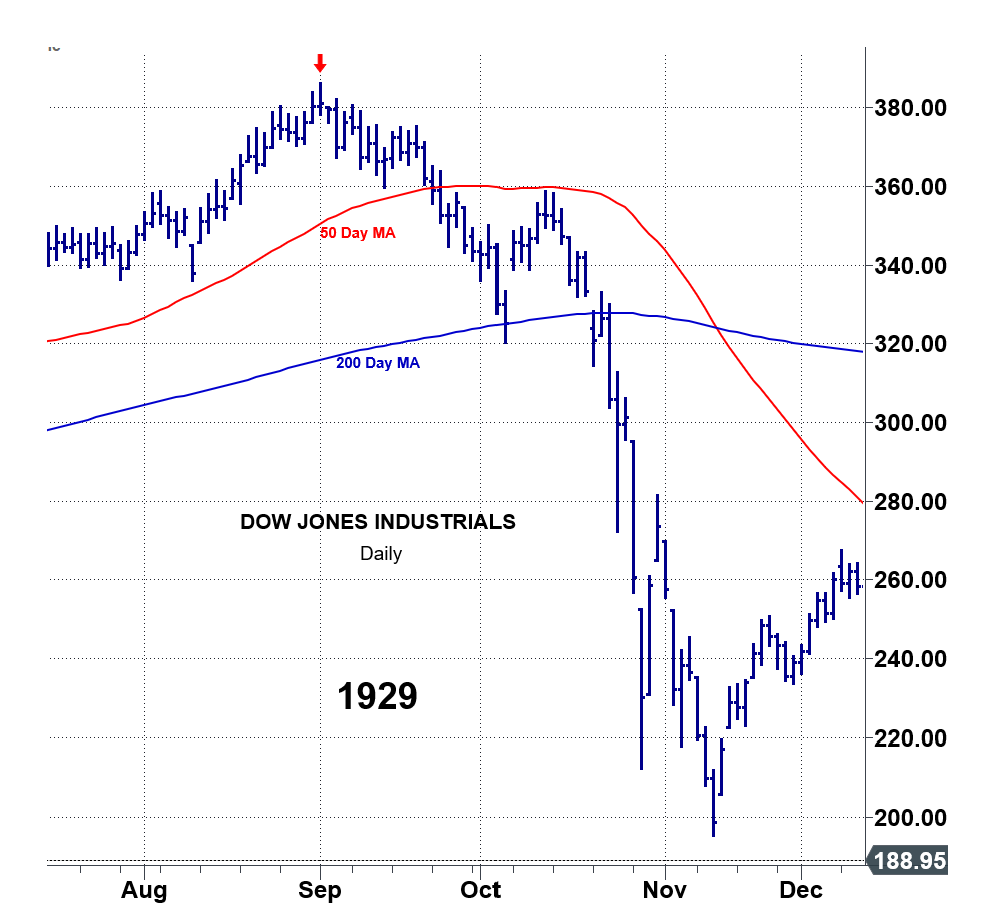
Notice the rally into early October 1929 established a Right Shoulder.
The DJIA crashed when it snapped a Neckline just below 340.
Notice the 1 DAY TURNUP into an open gap after the Neckline snapped,
The was the last graceful exit.
The rest was History.