“It’s off the hook” The Rolling Stones
Joe Granville, one of the most successful technical analysts of the 20th century, often spoke of ‘the hook.’
He explained that one indicator would fail to confirm what the others indicated at nearly every critical turn, whether a top of bottom. This ‘hook’ would lead the vast majority of traders to disbelieve the overwhelming weight of the evidence of a trend reversal signaled by the market…
In the present case, a presumed trend reversal to the downside.
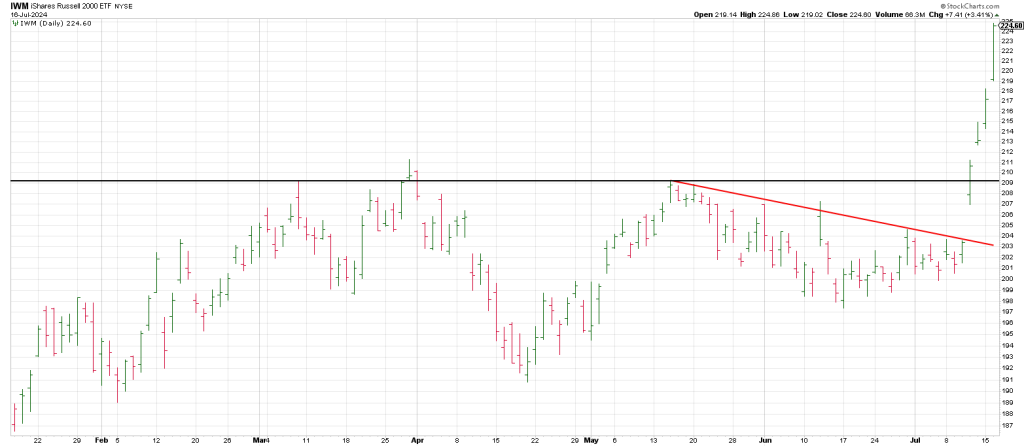
If he were alive today, Joe would likely tell us that the daily new high in IWM for the last 7 months is probably The Hook that would cause most traders to disregard or miss this critical topping area.
They would let the yearly high in IWM overshadow the overwhelming weight of evidence of other metrics.
The Hook is that this has been the largest 5 day IWM outperformance since October 1987.
We all know what followed. Now THAT was a “Dundee”.
Below is further evidence of the universality of the weight of evidence that traders “let off the hook”. They ignore these other blaring warning signals.
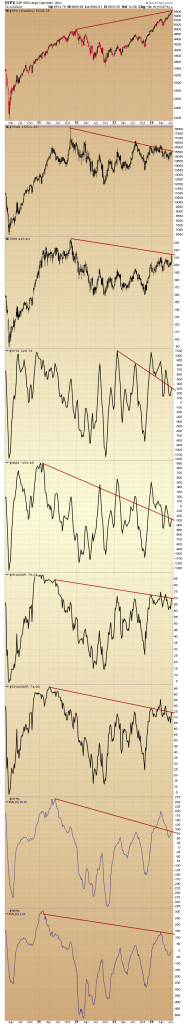
Metric 1 is the SPX cash
Metric 2 is the Transports
Metric 3 is IWM
Metric 4 is the NY Summation Index
Metric 5 is the NAZ Summation Index
Metric 6 is the number of NYA stocks above their 200 DMA
Metric 7 is the NYHL, the NYA new highs/new lows ratio.
Metric 8 is the NAZ new highs/new lows ratio.
Each of the weekly chart metrics covering the 4 years since 2020 fails to confirm the SPX new high.
Yesterday I tweeted that every dog’s ass has it’s day in the sun. that IWM will need SPF 100.
I’ve never seen such a short covering move in the smalls across the board en masse in my career.
Why?
1) ‘no one’ owned these names and people were short.
2) Remember the last hour in the SPX on Friday? The index dropped from 5651 to 5610.
41 handles in one hour. Why?
Well, on Saturday as we all know there was an assassination attempt on Trump that failed.
Someone always knows. Is it possible that someone big was shorting the market on Friday and had to cover on Monday? The SPX gaped up 22 points on Monday and rallied another 22 points into the bell.
Now I’m not saying that IF some big entity caused the entire outperformance in IWM and DJIA but they have been the weakest link and it would make sense to short the weakest into a ‘news event’. What I’m saying is a fuse was lit, a short-covering fuse that fed on itself.
Market participants assume this was the long-awaited promised land of the Great Broadening Out.
Pshaw.
The last 5 day rocket in IWM is not “broadening out” and healthy rotation.
It is a IED, an Improvised Explosive Device.
It perpetuated a Jailbreak Rally.
Be that as it may Mr. Momentum dies hard.
Even with the S&P futes down 40 this morning, IWM is green as I write 3 hours before the bell.
That said an hourly IWM warns against chasing right here.
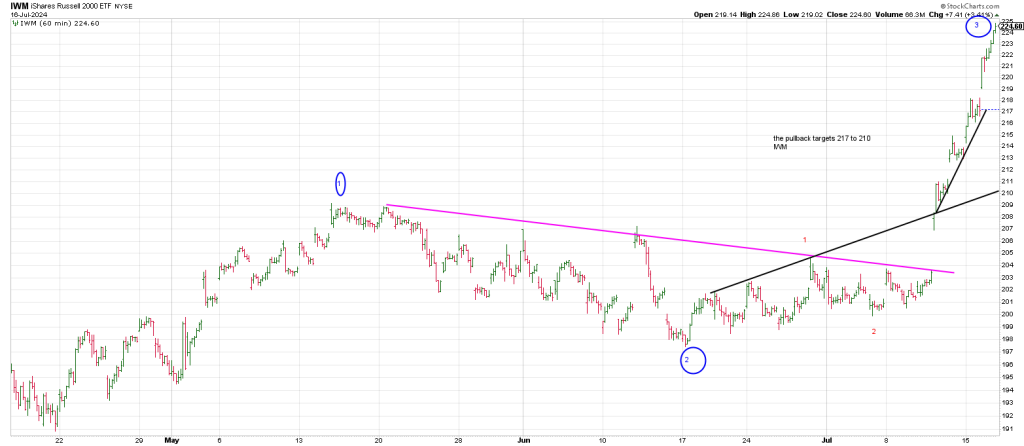
It looks like a 3rd wave with a 4th wave correction on deck.
That 4th wave looks like it’s eyeing 217 to 210 region.
The eye of the pullback centers on 213. Below the open gap at 218 opens the door to 211 region.
When the Chips Are Down
When the chips are down, you have to play your cards close to the vest.
This morning the chips are getting taken to the woodshed.
It’s Fargo in Chip Land.
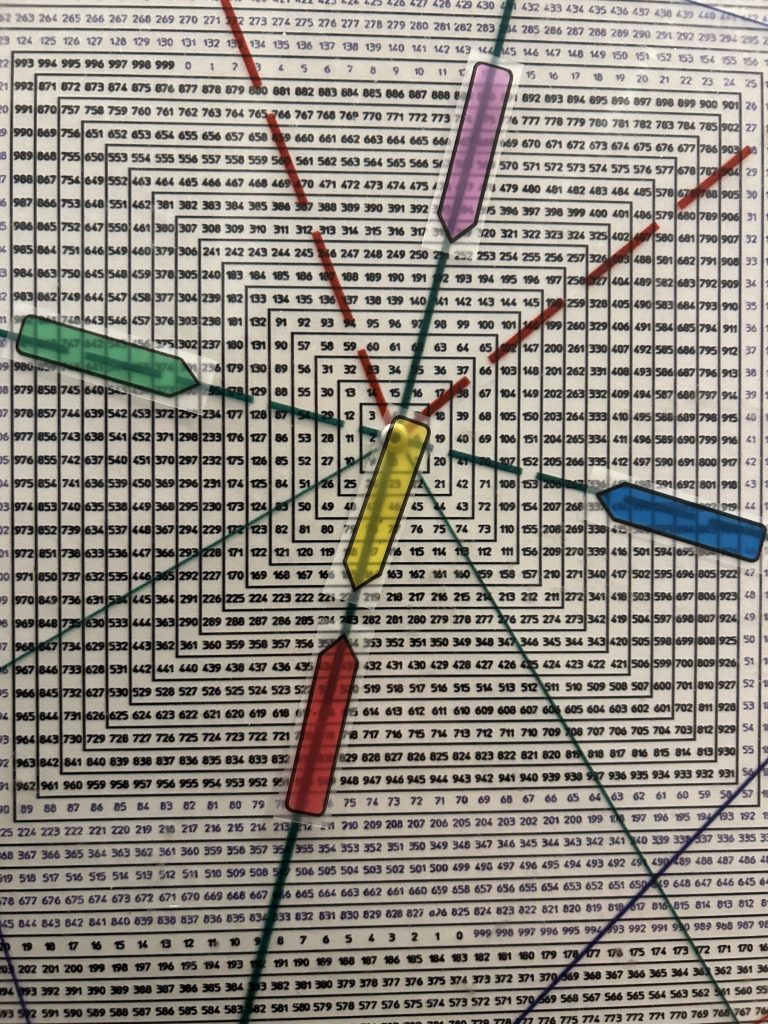
SMH the Semiconductor Index is trading down 8 points to 266.
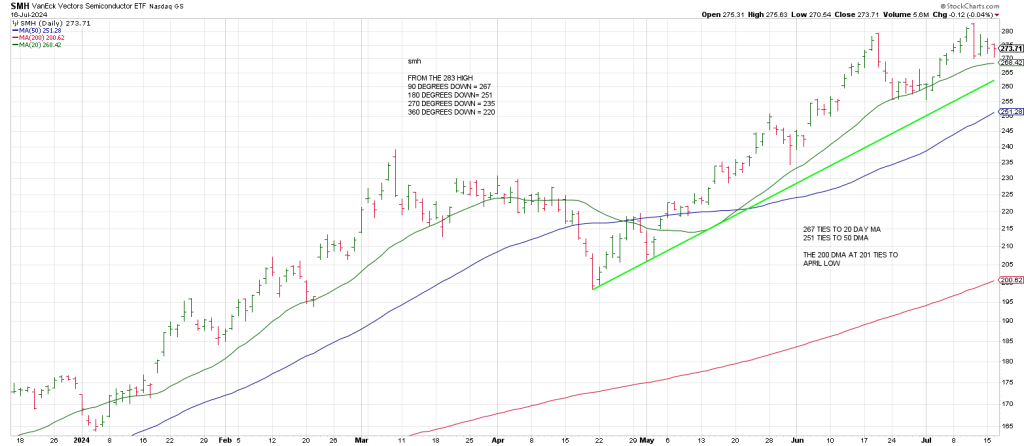
From the 283 high
90 degrees down = 267. So SMH is testing 90 degrees down this morning in tandem with its 20 day MA.
180 degrees down =251 which ties to the 50 day MA
270 degrees down – 235
360 degrees down = 220 which ties to the 200 day MA and the April low
Note the Bottoms Line (green) at 263 region.
The chips are dragging down the Q’s.
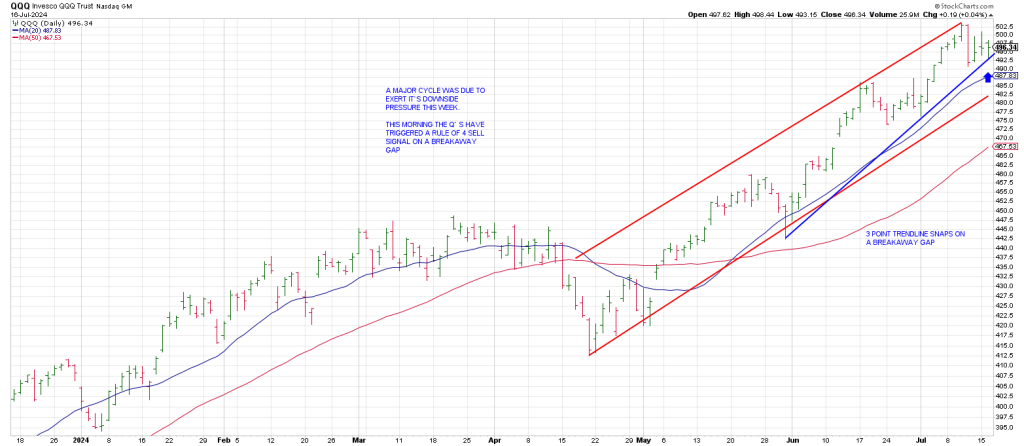
From the 503 high 90 degrees down is 481.
This ties to the bottom of the red trend channel.
There is a strong likelihood that QQQ will be magnetized to the 481 region quickly as it is triggering a Rule of 4 Sell (a break of a 3 point trendline) on a Breakaway Gap this morning.
In other words QQQ is snapping a 3 point trendline on a gap this morning.
180 degrees down = 459.
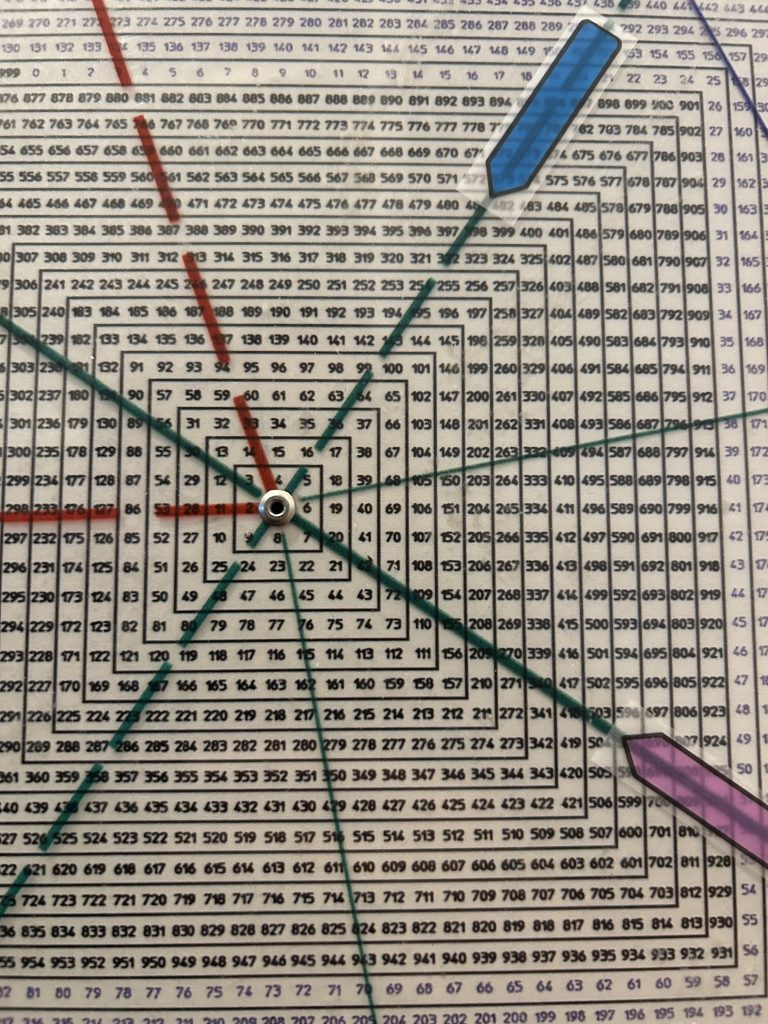
In sum the last major cyclical bull market topped in mid-July 2007.
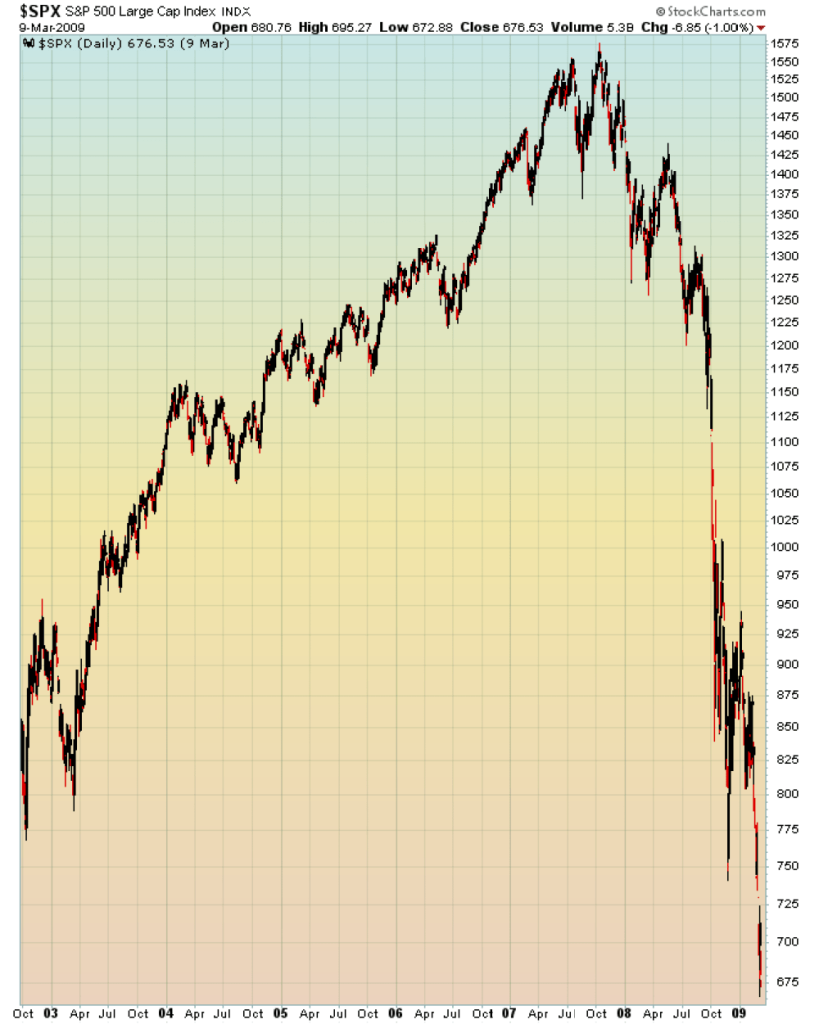
We are 17 years from July 2007.
Interestingly, on the Square of Nine 360 degrees up from 17 is 37.
They are an octave apart. The fall of 1987 and 2007 vibrate off 2024.
37 years ago there was a plunge into October. ..1987
17 years ago there was a spike into October….2007.
The Principle of Alternation indicates a plunge into October 2024.