Despite the old saw of the Santa Claus rally, markets have often changed their trend, turning down, around the Thanksgiving/Christmas holidays.
That pattern may hold true this year for several reasons:
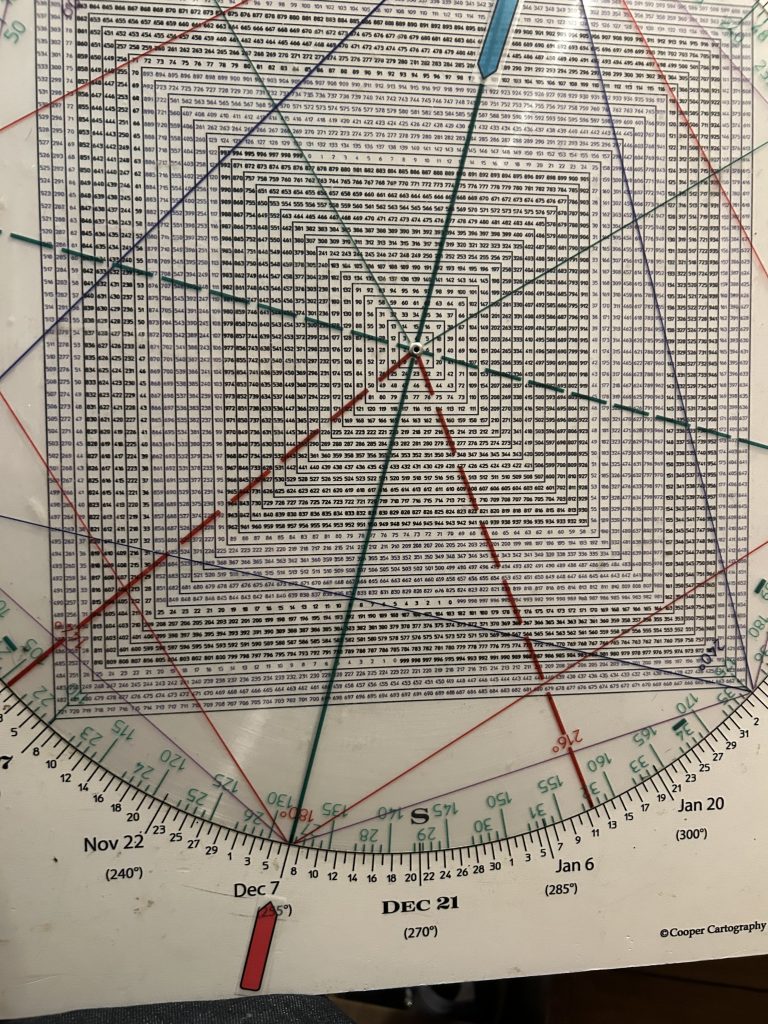
- The Dec 7th confluence we walked through in Wednesday’s report.
- The 602 (6020) square-out.
Let’s look at the Holiday Turning Points in the last 70 years.
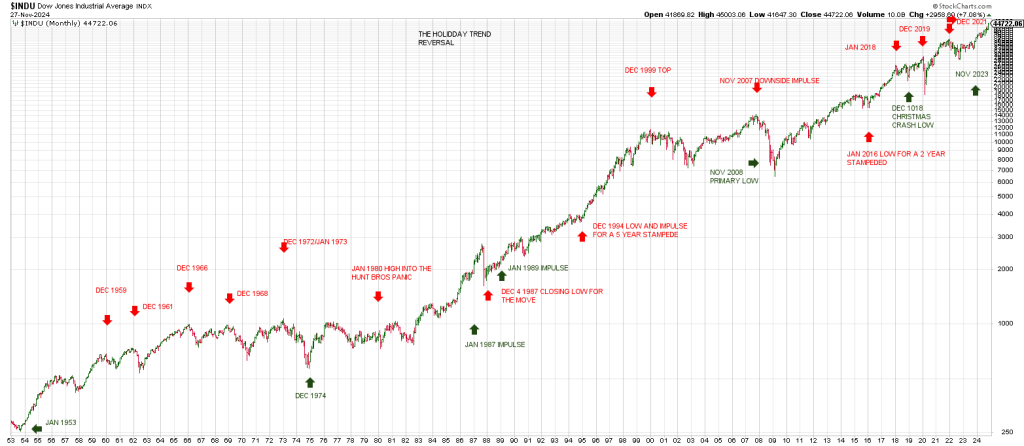
JANUARY 1953 marked the upside impulse which led to the DJIA finally eclipsing the 1929 peak in 1954.
SIX years later DECEMBER 1959 marked a high close with JANUARY 1960 being a Key Reversal Month prior to a 1 year bear market.
DECEMBER 1961 marked a high close prior to a waterfall decline into June 1962.
JANUARY 1966 was the high prior to a secular bear market that didn’t bottom until 1980-1982.
Two years later in DECEMBER 1968 the DJIA tested the 1966 high in a B Wave followed by a downdraft into May 1970.
The May 1970 low was followed by a run-up into the DECEMBER 1972 closing high and the JANUARY 1973 major high and reversal that signaled the start of a 2 year decline with a loss of 50%.
The low of the decline was in DECEMBER 1974.
JANUARY 1980 marked a closing high followed by a panicky selling into the March Hunt Brothers 1980 Panic that marked the Primary Low for the secular bear market.
That low would be tested in August 1982 at the start of a secular bull market.
JANUARY 1987 marked an impulse following a 9 month sideways stint (similar to the sideways stint in 1929 prior to the 3 month blow-off)
.The JANUARY impulse in 1987 led to a top 8-9 months later followed by the infamous October 1987 Crash.
The post-crash closing low for the drop was on DECEMBER 4th, 1987.
Another upside impulse occurred in JANUARY 1989 which marked the breakout over the 1987 top and an persistent uptrend.
That uptrend accelerated following a low in DECEMBER 1994 after an 8 to 9 month sideways stint.
The DJIA exploded from JANUARY 1995 into JANUARY 2000.
Actually DECEMBER 1999 marked the closing monthly high with JANUARY 2000 being a large reversal bar.
It was a Primary High prior to the August/September 2000 Secondary High.
November 2007 marked the downside impulse for the Great Financial Crisis.
November 2008 marked the Primary Low of the GFC.
JANUARY 2016 marked the start of a major impulse to the topside into JANUARY 2018 and Volmageddon.
DECEMBER 2018 marked the bottom of that year’s Christmas Crash.
DECEMBER 2019 marked the monthly closing high prior to the Covid Crash.
DECEMBER 2021 was the closing high prior to a 10 month sharp bear market.
November 2023 was the impulse for a runaway move that saw a closing high for the move so far on Tuesday in the DJIA.
Interestingly, as we know, the high on the SPX in this time frame ties to a potentially important square-out at 602 (6020) which we’ve outlined in this space.
The SPX has exploded 1921 points from the October 2023 bottom.
It been a powerful advance with no more than 3 weeks against the trend. The SPX 3 Week Chart has only turned down twice in the last 13 months.
Clearly the market has run up into this Holiday Turning Point Period. It may not be a high, but it ain’t a low.
Maybe something maybe nothing but 1921 (the number of points of the last 13 month advance) is straight across and opposite our December 7th date. Is it a Date With Destiny?
Since the spring I have noted the potential that 2024 is a mirror image fold back of 1929: The DJIA crashed into a low on the week of November 11, 1929.
The SPX struck a closing record high on November 11, 2024. On Wednesday it made a nominal new closing high 20 points higher. Will this morning’s rally elicit another record closing high on the weekly closing basis?
Curiously, 1921 is also the year the Roaring Twenties started.
Below are the five most negative breadth days on the NYSE when the SPX closed at a record high,
- July 19th 1999, -1,129 net declining issues
- December 5th, 1999, -1082 net declining issues
- March 7th 2000, -1065 net declining issues
- July 17th, 1998, -1032 net declining issues.
- February 2, 2018, -994 net declining issues.
Wednesday’s breadth at a record SPX closing high was 831 net declines.
The Haunting of a Holiday High looms large in Mr. Markets legend.