“Sometimes I wonder
What I’m a-gonna do
But there ain’t no cure
For the summertime blues.” Summertime Blues, Eddie Cochran X The Who
“Success always makes obsolete the very behavior that achieved it.” Peter Drucker
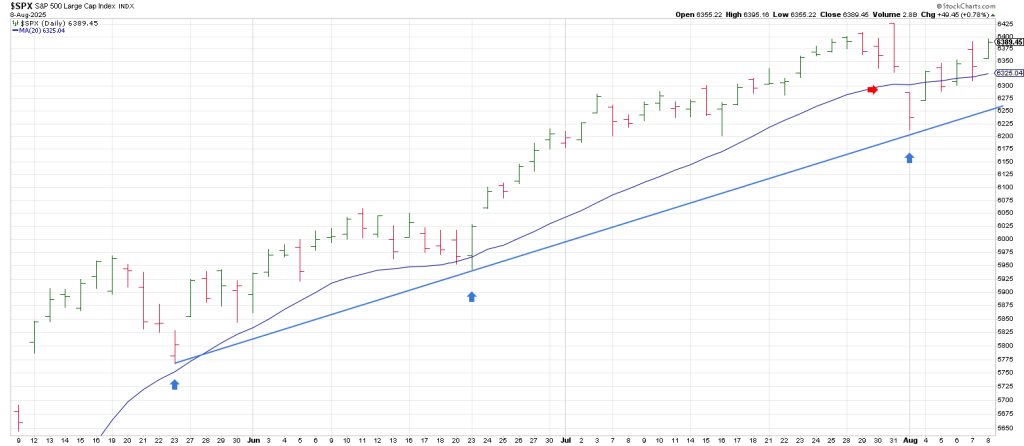
On July 31, the SPX left a large range Key Reversal Day.
Ditto the NDX.
Friday August 1st the both followed thru to the downside with Breakaway Gaps below their 20 day moving average.
It was the first real break of the 20 DMA for both indexes since the 20 DMA was recovered on April 24th on the heels of the spring crash.
Let’s look at the SPX first.
Yes that was a crash in the spring—not in the classic sense of a quick 20% plus waterfall but it was 1312 points or just shy of 12% to 4835 SPX in a Gann 7 week panic.
In sum,, the market took the A train versus the scenic route to the April low/test of the January 2022 top.
The crash was classic in the sense that it stopped right where it should have—on a test of the January 2022 peak of 4818.
The bottom was marked by large range weekly Train Tracks.
Technical analysis, what a concept.
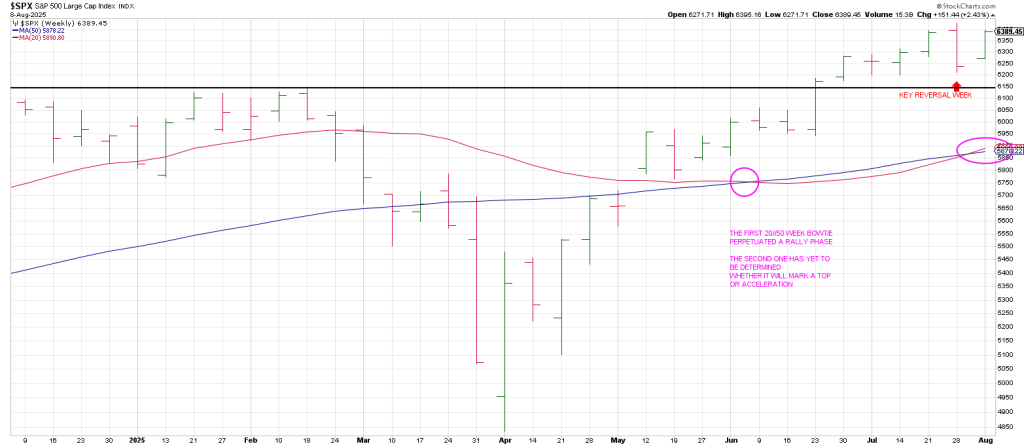
The rebound became more than a rebound when the SPX gapped over its 50 and 20 week moving averages in early May at the 5900 region
That said it was already telegraphing the prospect for at least a test of the highs when it reclaimed a 50% retrace in the 5440 region on a closing basis on the week of April 21.
Turning back to the dailies, following the July 31 Key Reversal day and the August 1 Breakaway,
A Black Monday was averted. Magically. We could have easily seen a Flash Crash on the one year cycle ala the first week of August 2024.
Instead a powerful rally played out “saving the baby”.
The near 200 SPX point drop in 2 days kissed a rising trend line from the important May 23 low.
When the August 1 gap was offset with a Jump the Creek buy signal the door to higher prices was open.
The ensuing extension higher wasn’t pretty.
Last week was extremely volatile with the alternating up days and down days.
Monday was strongly green.
Tuesday retreated.
Wednesday was up.
Thursday had a strong reversal to the downside.
All in keeping with the Roadmap for last week.
However, the Roadmap was off the mark on Friday as it was looking for a Trend Day down.
We got just the opposite and there was no Inversion Pivot to account for it.
The result was a new record closing high on Friday by a smidge, albeit still below the July 31 record intraday high.
The SPX looks on the way to trigger a weekly Keyser Soze on clearing and holding above the Key Reversal Week the last week of July.
The normal expectation is that offsetting the July large range weekly reversal would be a blaring siren for higher prices.
Maybe.
Since the 2009 low I show two Key Reversal Weeks (sells) — the first on the week of Jan 3, 2022.
That of course was not off set quickly. It took two years to eclipse that 4818 peak.
So you can see that the April 2025 test of that region was a significant area.
The second Key Reversal Week was the week of July 15, 2024 from a high of 5669.
It led to a Flash Crash.
It was not cleared quickly.
The SPX didn’t rise above that 5669 level until 2 months, later, the week of Sept 16, 2024.
It’s not happenstance that the market flipped the switch to new highs in May 2025 at the 5700 region—the May Breakaway Gap on May 12—as it ties to the aforesaid 5669 level.
The SPX acceleration from May 12 theoretically ended on July 31st.
Interesting the pre-crash blow offs from both 1929 and 1987 both started in May.
The blow-offs in 1929 and 1987 ran 95 to 97 calendar days.
Counting from May 12, 2025… July 31 was 80 calendar days so theoretically if the market is going to mirror those two historic blowoffs we are looking at August 15 to 17 as a potential pivot.
However counting from the April 7 low to July 31 is 115 calendar days— meaningfully exceeding the 1929 and 1987 summer blow-offs.
We know that August 2025 is significant.
As noted last week on the Square of 9 Wheel, 2025 squares-out with August 8.
1987 is a “6” year. 8 +7 = 15 = 6
1929 is a 9 year ending in 9
2025 is a 9 year. 2 + 2 + 5 = 9
2009 the low is a 9 year (ending in 9).
If this is a larger degree Super Cycle then a 180 degree blow off from May points to November.
And the year 2025 conjuncts/aligns with November 7.
The year 1929 squares August 20th and is opposite November 19th.
August 20th ties to the September 3, 1929 top and the August 25, 1987 top.
November 19 ties to the November 13 low for the year in 1929. The crash low.
The year 1987 squares out with October 29…the day of the Big One in 1929.
These are just some of the harmonics in the matrix of what some call the Random Walk…despite evidence offered by the Square of 9 that proves the market is deterministic.
Checking the Q’s shows they actually rallied 14 cents above the prior week’s Key Reversal Week high of 574.63.
The Q’s rallied to 574.77 closing at 574.55, just shy of closing above the weekly all-time high.
Be that as it may, the Q’s closed at a new record high.
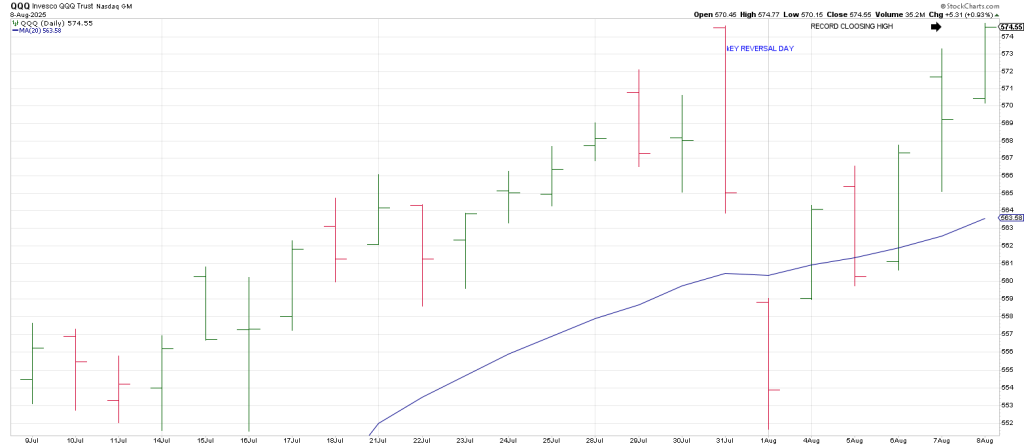
This sets the Q’s up for a possible Soup Nazi sell signal on the dailies if they jacknife below the July 31 high today or Tuesday.
Last week we showed the QQQ Rising Wedge below.
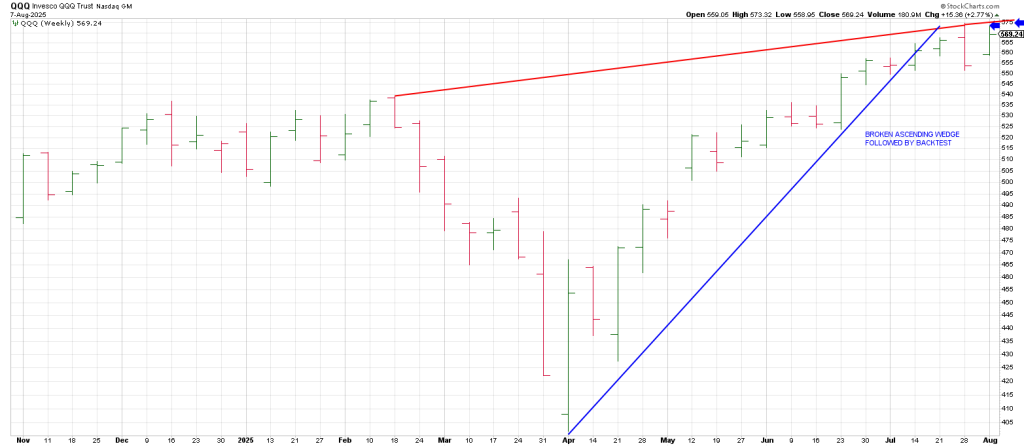
My thinking is this:
Just because the Q’s may rally above the Rising Wedge is not necessarily bullish.
From my perspective with such a large cycle on the table, it would seem normal for a false breakout.
Likewise, last month we showed the Tops Line from 1929. Each hit rejected the DJIA.
But with a potential Super Cycle Top in play, wouldn’t the normal expectation be for a breakout over the 1929 trend line?
If so in both these technical instances, it will serve us well to take to heart that fast moves come from false moves.
In sum, while the SPX has not yet offset its Key Reversal Week, the Q’s have.
As mentioned from 2009, I could not find any immediate weekly Keyser Soze’s following Key Reversal Weeks.
In other works no quick upside Reversals of Key Reversal sell weeks.
However, interestingly, the SPX left a Key Reversal MONTH at the July 2007 top.
Following a sharp break the SPX offset the Key Reversal Month in October.
Clearing the Key Reversal Month triggering a Monthly Keyser Soze could have been wildly bullish.
It was not.
Instead it marked a double top and was the hook that out the nail in the top before the Great Financial Crisis.
For the moment the QQQ has immediately eclipsed the prior weeks Key Reversal Week.
One conceptually correct maxim about markets is that follow thru is key.
Let’s see if we get follow thru above the prior weeks Key Reversal Week.
If so it may lead to a further blow-off but key indicators are flashing red.
1) The McClellan Summation Index for the NYSE and NAZ extended their downtrends signaling deterioration. 17 of the last 18 McClellan Oscillator closes have been negative—at SPX record highs.
The 10 day average sits at -30.93, the lowest in 100 years at a market high.
Downside momentum at this market high juncture is the most extreme in a century.
Below are the 10-day average McClellan Oscillator readings at prior cycle tops over the last hundred years.
| Year | 10-Day Avg |
| 1929 | +18.32 |
| 1937 | -19.92 |
| 1967 | -18.00 |
| 1973 | -5.81 |
| 1980 | +21.92 |
| 1987 | +6.64 |
| 2000 | -3.20 |
| 2007 | +36.42 |
| 2020 | +1.07 |
| 2022 | +27.59 |
| 2025 | -30.93 |
2) Only 50% of the NDX stocks are above the 50 day moving average at this all time high. This is a 100 year record
3) Just 58% of SPX stocks are above the 200 DMA. A 100 year record.
In sum, the end of July Key Reversal week was the largest weekly Key Reversal since July of 2024 and before that, the market top in January 2022.
Each of those times the market was down four weeks in a row. And of course, Jan 2022 was the start of bear market.
If the market doesn’t “Soup” and jackknife back down in short order we may get a cherry on top of this banana boat.
Tomorrow’s report will show an analogue from the last ditch run in 1929.
If the pattern lines up it will equate to the late August time frame of the 1929 and 1987 tops.
We’ll take a look at what the Wheel projects if the market stands on its heels.
But as we know time is more important than price.
Gold update.
GLD has been trading sideways since a large range reversal week in late April 2025.
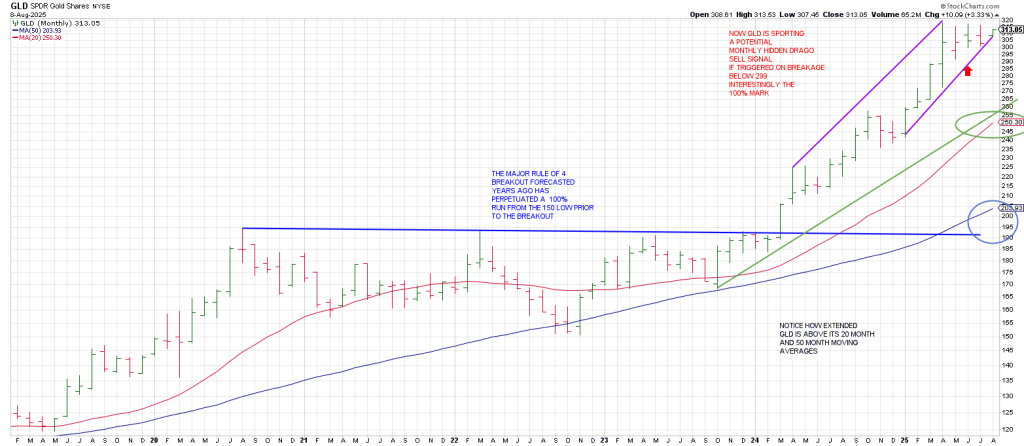
GLD broke a weekly Bottoms Line in late July but recovered.
Another break below the near term support opens the down door.
Support ties to 285.
The 20 week moving average has acted as key support since Feb 2024 low.
August 2025 is 540 degrees forward for a potential cube in time and gold has a history of major turns in August such as 2011—14 years ago or 168 months.
168 squares mid-August. This week.
This may be a key week for gold after a Ketchup surge in the miners of late.