“Well, you can’t say yes and you can’t say no
Just be right there when the whistle blows.” All Down the Line, The Rolling Stones
“I assume that markets are always wrong. Even if my assumption is occasionally wrong, I use it as a working hypothesis. George Soros
They say price doesn’t lie. That the market is always right.
But price is only half the equation in the market. The other factor is time.
And, as W.D. Gann wrote, “Time is more important than price.”
It is the relationship between time and price, that is the truth of the tape.
Only when time is up does price turn.
Just as relationships give expression to human life.
Relationship of time and price give expression to human trading.
That is the power of the Square of 9 Wheel; to integrate Time and Price.

Square of 9 Wheel
Purchase your own Square of 9 Wheel. Shipping to US only. Contact Jeff for shipping outside the US.
The human factor cannot be captured within the lines.
No single expression is an exact replica of a previous one…despite great comparisons.
Markets have a rhythm, but it is not perfectly syncopated.
Allow me to explain.
I had a friend. He was an engineer. He was also a money manager.
His quest was to systematize his market operations…like a true engineer there was no room for psychology or emotion. All black and white.
This is true when you are building bridges, but emotion is the mother’s milk of markets.
After the 1987 crash hit, although he had his clients largely in cash, he closed his business.
He would tell me if a quake of that magnitude could hit the market, out of the blue,
He could not factor in the risk. and thus not take risk.
Of course there is no gain without risk. And, sometimes, risk is just risk and cannot be hedged away.
Of course the 1987 crash was not out of the blue. As Paul Tudor Jones performance during that time seeing the parallel pattern from 1929 attests to.
Maybe PTJ was just the one of a thousand monkeys in a room that typed Shakespeare’s Hamlet?
But I doubt it.
My friend tried for years to systematize and automate a program that would mirror the markets pulse.
After a decade he abandoned the project.
It comes down to the fact that, as offered above, no single movement is an exact replica of the previous movement, despite great comparisons.
The market isn’t canned heat and resists (resents?) being categorized.
“The generally accepted theory is that financial markets tend towards equilibrium, and on the whole, discount the future correctly. I operate using a different theory, according to which financial markets cannot possibly discount the future correctly because they do not merely discount the future; they help to shape it.” George Soros
Hence, in my opinion, you have to handle Gann’s methods “playfully”.
The moment you try to follow Gann’s theories to the letter you get stuck, as the human factor cannot be captured within the lines. But we draw the trend lines anyway…because they work—until they don ‘t.
It’s all about the “behavior” when a trend
line or a square-out is broken—or not.
To see the market in the context of science or the dismal science (economics) is to lose sight of the market:
without imagination we will not understand what the market has in mind.
They say, price is truth, but that is not the reality.
The market lies. It’s job number one is to deceive.
Truth is ‘time-based price’.
Time and price integrated.
W D Gann: “Remember the old Chinese proverb: ‘one good picture is worth 10,000 words’. You should make up charts and study the picture of a stock before you make a trade. You should have a weekly high and low chart, a monthly high and low chart and a year high and low chart. A yearly high and low chart should run back 5, 10 or 20 years.”
And in that one sentence Gann left many clues to his Master Time Factor.
We have looked at the 5 year cycle many times in this space.
If we round off a year and use 360 degrees/days (versus 365) as a year, 5 years is 1800 degrees/days.
Or an opposition, 180 degrees.
10 years becomes 3600 days/degrees or 360 degrees, hence the significance of the decennial cycle for repetition.
The 20 year cycle becomes 7200 days/degrees or 720 degrees which is TWO 360 degree cycles or a Passover of two Circles or Orbs. An eclipse if you will.
The 20 year cycle is the Jupiter/Saturn Conjunction Cycle.
These are Gann’s great chronocrators, Jupiter and Saturn.
Three of these conjunctions is Gann’s Mater Time Cycle of 60 years.
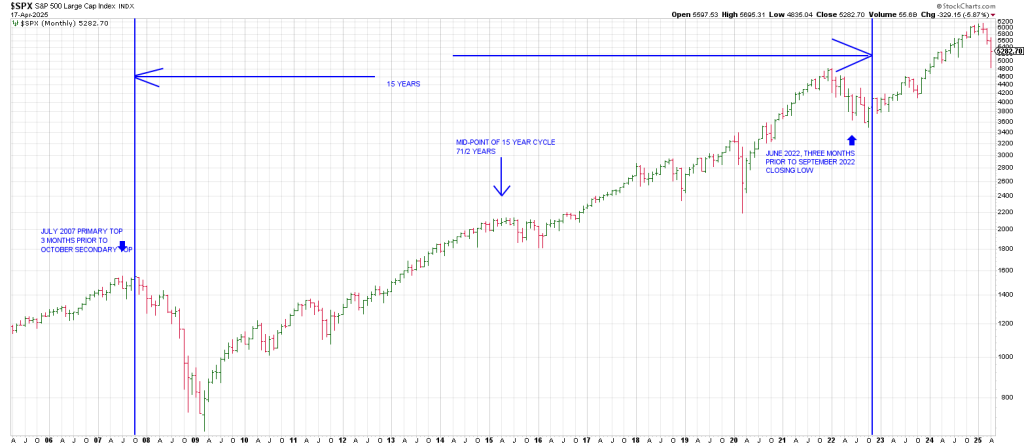
Just as 5 years divides the 20 year cycle into 4 ‘seasons’ or quadrants, 90 degrees of the 20 year cycle, one year is divided into four 90 degree seasons, so too 90 degrees or one season of Gann’s Master 60 Year Cycle is 15 years.
Every 15 years ends with Saturn (roughly a 30 year cycle) being exactly opposite the point where it began.
If you want to see the market, it’s right before your eyes. Look for the reoccurring patterns at reoccurring time intervals to work out the Law of Vibration.
For example: from the major October 2007 top, 15 years later gives the major October 2022 bottom.
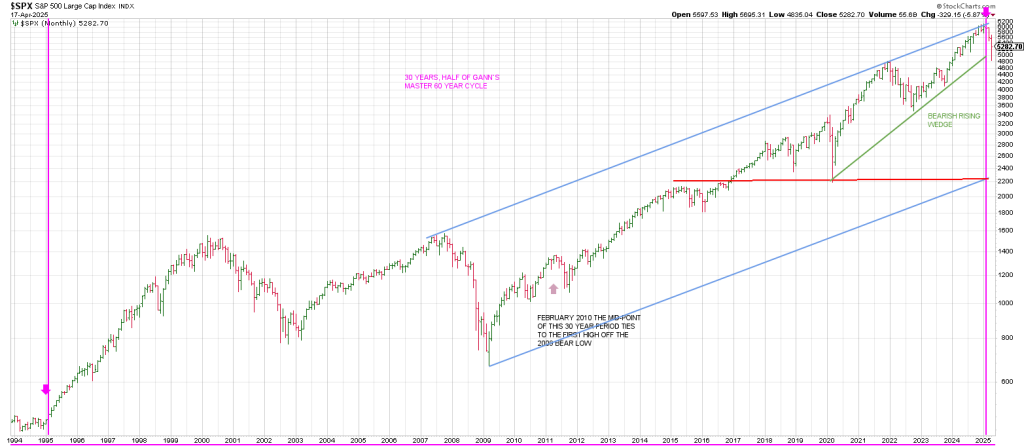
30 years (two fifteen year cycles) from the major February 1995 impulse/breakout is February 2025.
Clearly we got an impulse to the downside from a February 2025 top.
Is it possible a mirror image foldback is playing out?
We posted the SPX weekly below in the Sept 30 report showing a mid-channel line congruent roughly with the April 2024 low and the January 2022 peak.
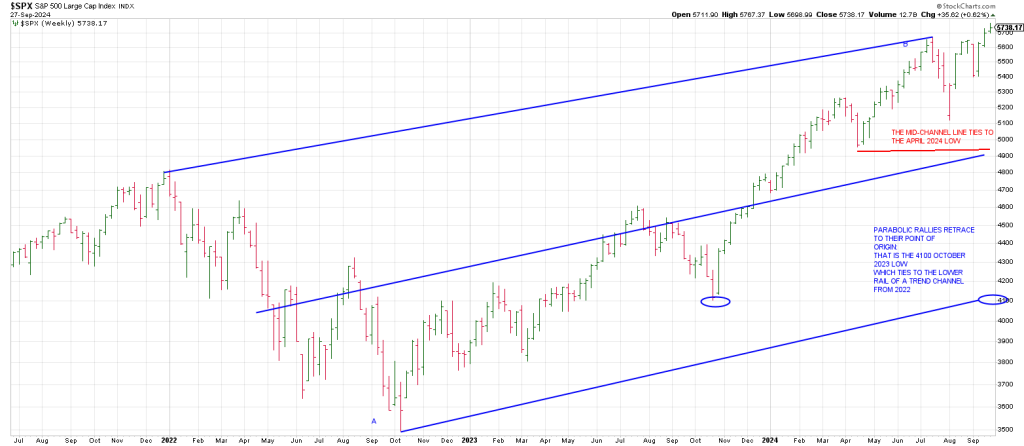
The SPX broke out above the top of the trend channel signaling a blow-off ultimately driving to 6147.
It then pulled back sharply satisfying our expectations for a downdraft from January back to the 5100-4800 region.
This is the August 2024 low and the January 2022 peak respectively: vertical runs typically return to their point of origin (5100) and prior resistance (4800) acts as new support…at least the first time down.
The SPX pulled the rubber band back on a turn down of its 3 Week Chart into early August 2024 perpetuating the run to the 6147 all-time high in February 2025..
Notice the turndown in the 3 Week Chart also defined the April 2024 low (4953).
Currently the bottom of the trend channel resides at 4100 the major October 2023 low that elicited an almost exact 50% stampede in 69 weeks.
Amazing symmetry.
How does Time and Price integrate with the big picture?
On the Square of 9 Wheel SPY 410, blue, the Oct 2023 low (409.21 low) squares out with 613, red, the SPY all time high.
613 is 2 full revs of 360 degrees up plus a 90 degree Throw-over from 410.
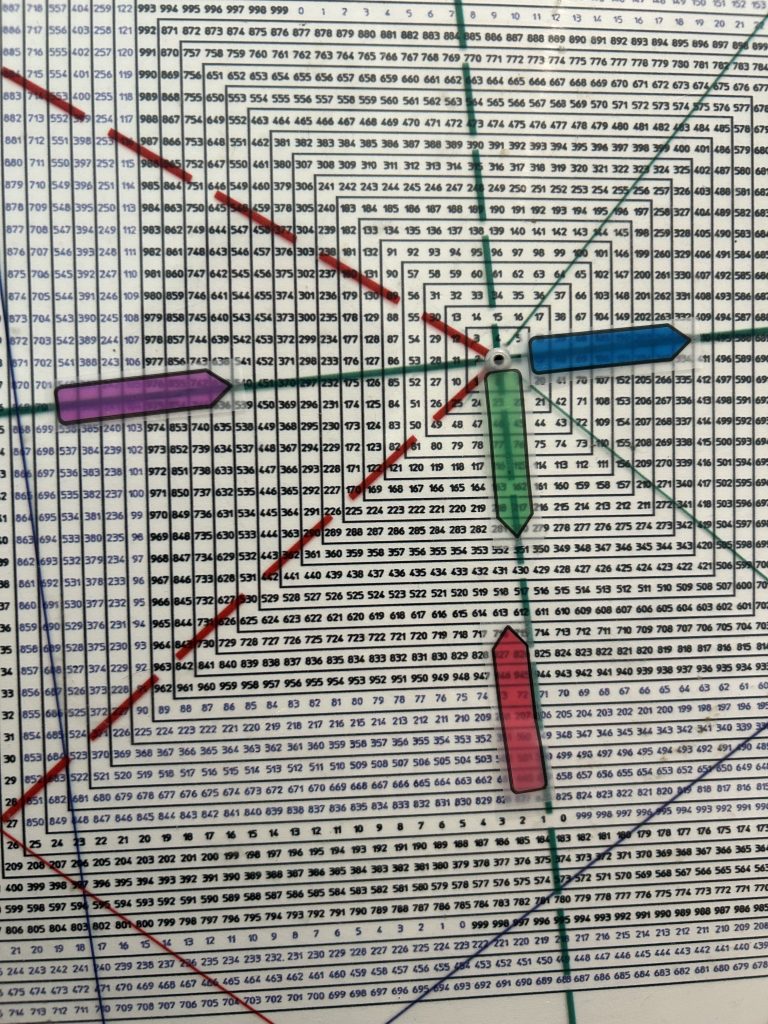
Notice how 613 is 3 full revs up from 351, green, which ties to the Oct 2022 low.
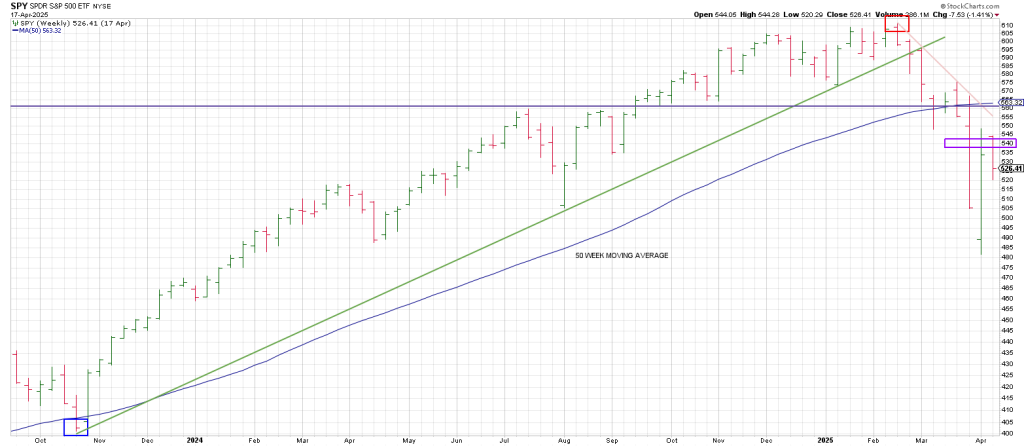
540 (purple) cubes out (540 degrees up) with the 410 Oct 2023 low.’’
This is important because the SPY has never closed above 540 on a weekly basis since the early April low.
If the SPY should reclaim 540 on a weekly closing basis it opens the door to 564 (5640 cash).
This ties to the overhead 200 day moving average.
My unorthodox interpretation of the Elliot Wave structure on the SPY is that a 5th wave selling climax played out in early April on the test of the January 2022 top.
A large A wave of Wave 2 countertrend rally was traced out from the April 7 low to the April 9 high followed by a B wave pullback that is progressing.
If this count holds up a C wave potentially sets up to the aforesaid 564 region completing an A B C wave 2 counter trend rally.
This 564 region is the summer highs, our Maginot Line for the Bull.
Breakage of The Line triggered a waterfall decline.
The greatest risk is the risk you don’t see coming.
There is a path, an interpretation, by which the SPX/SPY could morph into a new all-time high, one last ditch rally that leaves the bulls and bears alike in the dust.
How we will know when and where that is triggered and what the projection is we outline today on the Hit and Run Private Twitter Feed.