“Time destroys the speculation of men, but it confirms nature”, Cicero
“You and I will meet again
When we’re least expecting it.” You and I Will Meet Again, Tom Petty
The stock market typically experiences a 10% correction every 1-2 years.
Since 1980, the market has declined 10% or more every 1.2 years
The SPX experienced a 10% slide from July to October 2023.
A 90 day/degree decline.
From a July high in 2024 the SPX experienced just under a 10% downdraft into August 5.
A 20% or more correction in the market happens roughly once every 6 years on average,
In January 2022 the SPX started a 25% decline into October 2022—nine months later or 270 days/degrees, three 90 day/degree declines.
Which brings us to today.
The SPX is up 75% since the 3491 October 2022 low. 28 months. 2 years 4 months.
Anytime the market is up a lot in a relatively short period, analysts and the media mump on the opportunity for a click-worthy “crash story”.
People bandy about the word “crash” without knowing what they are really looking for.
There are crashes and there are crashes.
We haven’t really had a bust that stayed down since 1929.
Even after the 1973 top when the market declined just shy of 50% in 21 months, a rebound tested the region of the top in 1976.
Be that as it may, a secular bear market started in late 1929 that lasted until 1949.
A secular bear market started in 1966 that lasted until the double bottoms in 1980-1982.
We have had relatively short-lived debacles in 2008 and again in 2020.
From the 1930’s to the 1970’s is 40 years from 1980’s to the 2020’s is 40 years.
Long time readers have heard me say before that every 40 years something bad happens in markets and the economy and every other 40 years something really bad happens.
Since we had a greater than 20% decline from October 2018 into December 2018 and a greater than 20% decline in the 1st quarter of 2020 and then again in the first 9 months of 2022, if you’re wondering why we’re getting these 20% or more declines more often than roughly every 6 years, you’d be wondering up the right alley.
Is the market getting more volatile?
It’s a good question because on the one side you got the vast sums of money dedicated to the passive sedated approach and on the other you’ve got the methodical schizophrenia of the Algomatics.
It’s a tug of war that may be elevating volatility.
In a secular bull market, after a correction (10% or greater) or a pullback (5% or greater), once the markets starts to turn, it can recover quickly. The average recovery is just four months—that’s why investors are willing to stay invested for the long term—that’s all the current generation knows.
However compare that to 25 years after 1929 and a decade after the 1973 top.
A market crash is considered something greater than 20% by Wall Street.
Since 1950, the SPX has declined by 20% or more on 13 different occasions.
The average stock market decline was -32.7% and the average length of a market crash was 338 days.
There have been 34 stock market corrections since World War 2 with the average correction seeing the market drop by -14.3&.
A true market crash as opposed to a correction, can be brutal.
The average bear market (Wall Street likes to call anything more than 20% a bear market) cuts the market by 35.8% from peak to trough.
Contrary to some people’s beliefs, market crashes do follow predicable patterns.
We’re not going to go into the time and price synchronicity between 1929 and 1987 here.
We’ve done so several times in this space.
Suffice to say that they were 58 years apart.
On the Square of 9 Wheel, 58 squares out with October 29…the Big One in 1929.
58 is also straight across and opposite late January.
Late January 2025 intense volatility broke out.
It is only yesterday that the SPX was able to push above the highs of late January closing at a record 6144, slightly above the late January record close of 6t118.
Markets have a tendency to play out in ‘threes’. Will we see a third new record at 6160?
Moving the decimal point to work with the Wheel gives 6t16.
As offered yesterday 616 is an interesting square-out.
It is opposite 667, the SPX low in 2009 and it squares March 6th, the low day in 2009.
As WD Gann stated, “All important highs and lows are square-outs.”
Of course there have been several square-outs over the last year that could have been the top.
But the price action did not confirm the prospect.
As well, 481 for 4118i (the January 2022 top) squares out with the current time period.
Additionally, 610 (6100) is 3 revs of 360 degrees up from the 349 (3490) October 2022 low.
There’s a lot of ‘stuff’ at this 6100 + region.
So the question is if a 20% + decline is on the table, will it be an escalator or an elevator down?
Will it be a waterfall or a “normal” correction.
Is there a way to know unequivocally which one? The key word is “know”.
The short answer is no.
But we can get clues.
One such clue is anchoring zero on the Wheel to 1929, the year.
We see that 1929 squares out with this week and aligns with May 19th.
Ma y 19th was the exact day of the Secondary High in 2008, the high before the Lehman Crash.
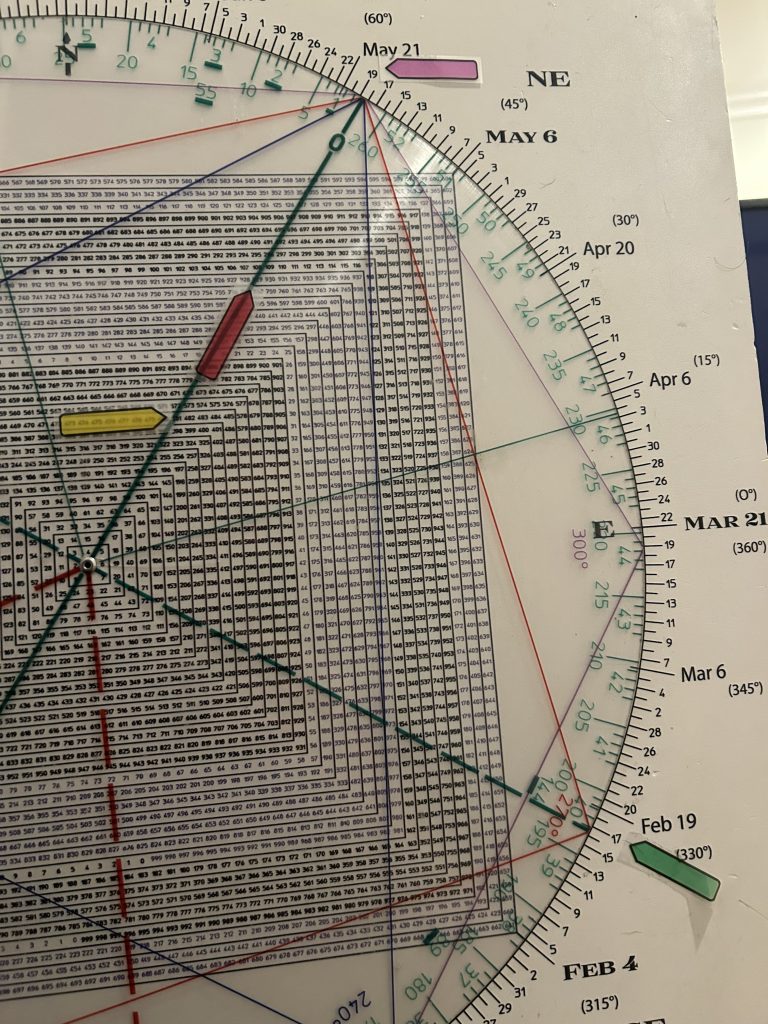
So 1929 on the Wheel vibrates/points to May 19th, the high before the 2008 crash.
The Great Depression pivot high and the Great Recession pivot high are harmonically connected.
Both square this week. If we see a high this week my expectation is a sharp drop into late May.
It may prove to be as much as 20%. Maybe more.
I recall in 1987 while the indexes were still levitating, the leaders of the day such as MRK and other blue chip names were hitting air-pockets after vertical rises.
Tuesday META saw its momentum come unglued.
Yesterday it was PLTR.
After the bell, another general, CVNA, reported. It dropped 30 points.
It left a tell-tale sign before the print: It had carved out a Key Reversal Day, closing at 281.82 from a session high of 292.84.
Someone usually knows.
This week also squares-out with 481 (4818), the January 2022 top.
So this shapes up as a pivotal week in time and price.
And it ain’t a low.
We know that the first week of March is the 16th anniversary of the 2009 low.
4 squared years ago.
We know that the first week of March is the 25th anniversary of the NAZ low in 2000.
5 squared years ago.
One of the reasons I enjoy this business is that there is always something new to learn.
It’s 3-D chess.
Yesterday I learned something new about planetary cycle.
I knew that Venus retro coming up had timed some major turns this century.
For example
October 10, 2002.
July 27, 2007 (near the Primary Top)
March 6, 2009
Oct 5, 2018
December 19, 2021 and Jan 29, 2022
July 23, 2023
That’s a pretty amazing array.
Then we have:
March 1, 2023
However, what I have learned is that Mars goes direct over coming days just in front of Venus going
Retrograde.
Mars and Venus return to the same synodic cycle together every 32 years and correlates to the following years:
2025/2026
1993/1994
Interestingly in 1993 and 1994, the market basically flat-lined.
The market didn’t succumb.
When the cycle completed, the SPX exploded in late December 1994.
This is a conceptually correct way to use cycles.
When all the cycle could do was flatten out the market, when the cycle had exhausted, the maket exploded.
1961/1962
The market peaked in November in 1961 waterfalling into June 1962.
It rallied sharply peaking in February 1962 and crashed into October 1962.
1929/1939
No comment.
If the SPX should drop 20% or so, it would take the SPX back to the 4818 January 2022 peak.
A perfect move on the chessboard as prior resistance should become new support.
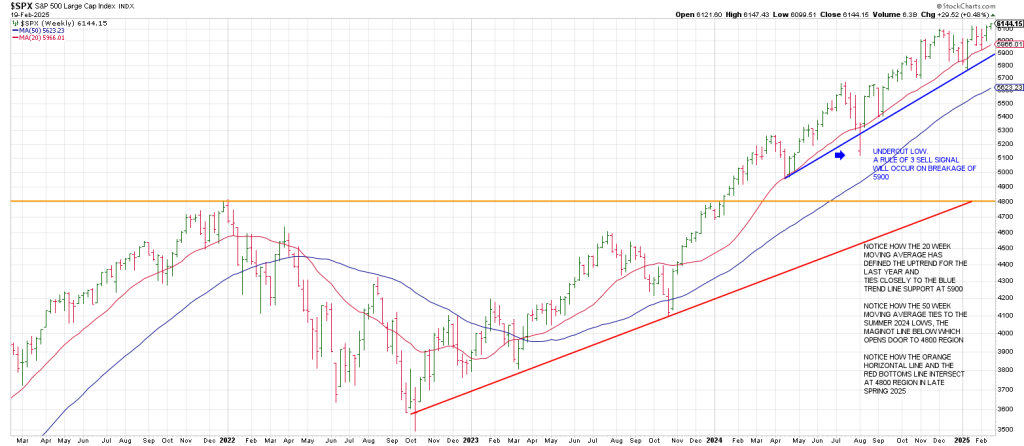
Mr. Market will meet the January 2022 top again.
Remember 481 (4818) squares out with May 17/19 and we are 90 degrees/days from that point this week.
This particular cycle is complete in October/November 2026 or 49 Gann months from the October 2022 low.
Consequently, my expectation is we get two near 20% declines into that time frame.
The Street is geared to buying a first decline. The market will disabuse them of this behavior.