“The only problem with fundamental analysis was that it appeared not to work.” Stephen Leroy, Journal of Economic Literature, December 1989
“You leapt from crumbling bridges watching cityscapes turn to dust
Filming helicopters crashing in the ocean from way above.” Apocalypse, Cigarettes After Sex
The origins of eclipse correlation to human behavior go back to the Mayans and ancient Chinese.
They were often associated with divine messages, warnings or a cosmic shift.
In modern times, some mathematicians and market analysts have found that many stock market crashes have occurred near lunar eclipses and solar eclipses.
Succinctly, that eclipses could influence market behavior, arguably due to gravitational forces exerted during eclipses that could disrupt equilibrium of financial markets, potentially triggering crashes.
My take is, if there is a connection, then the market has to be in a weak position to be affected.
In other words it will have already suffered some shocks and volatility, divergences and distribution.
Some argue that the very nature of financial markets defies simplistic causality, that there are too many moving parts, to attempt to identify seemingly unconnected events with the complexity of the stock market.
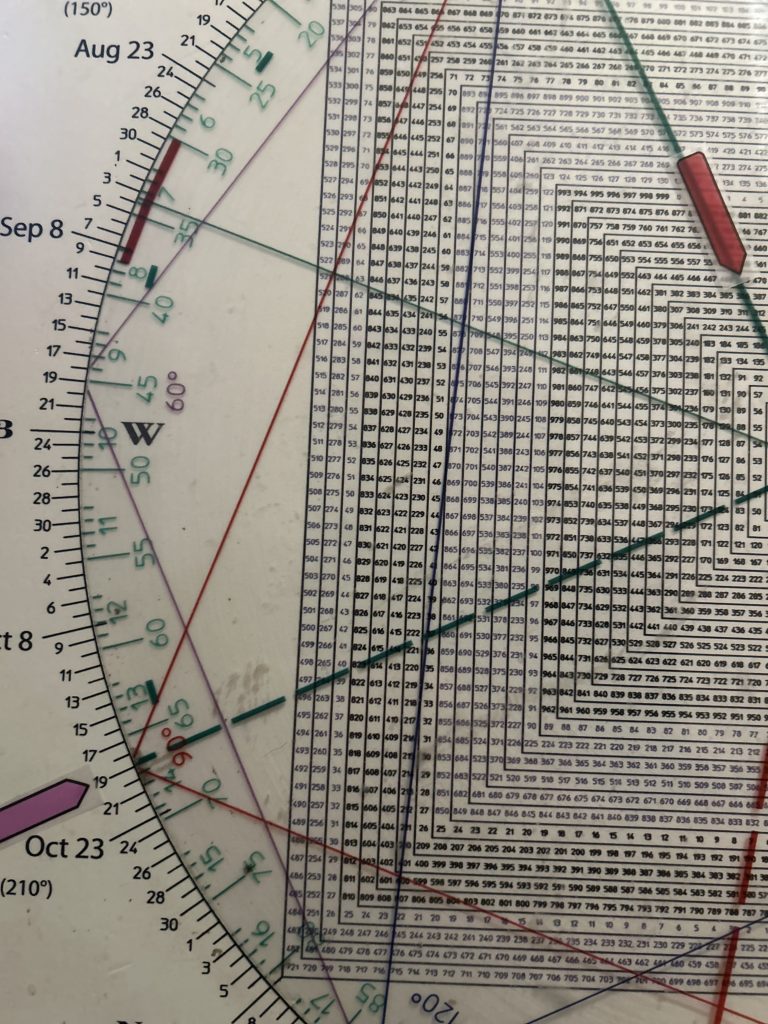
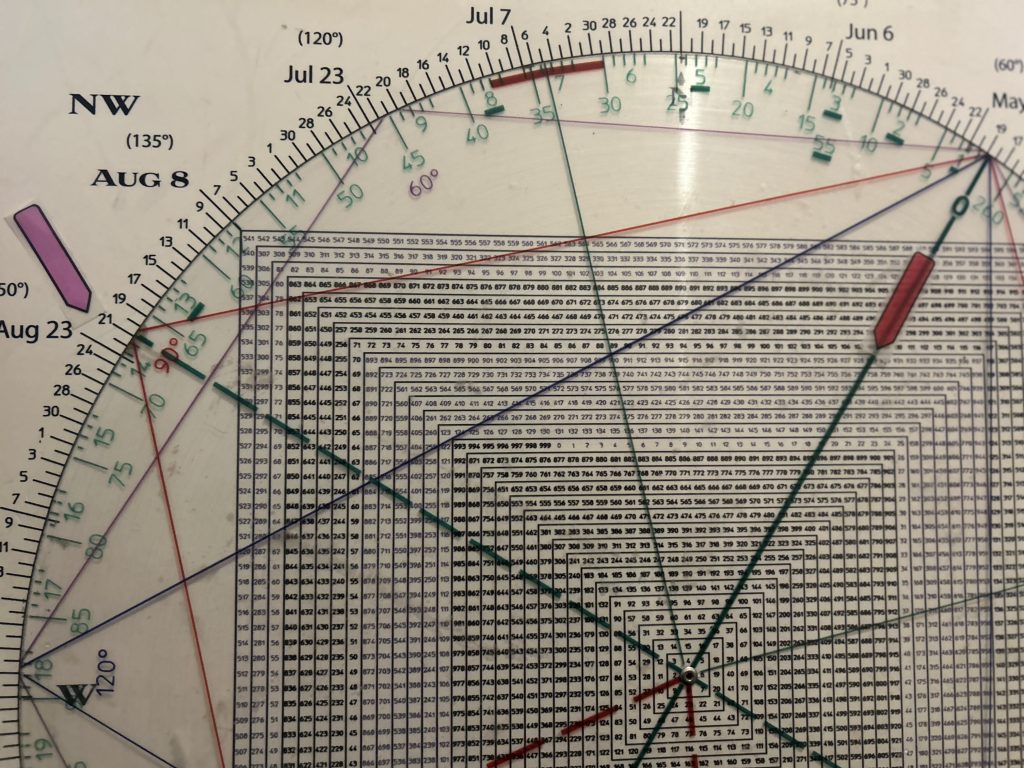
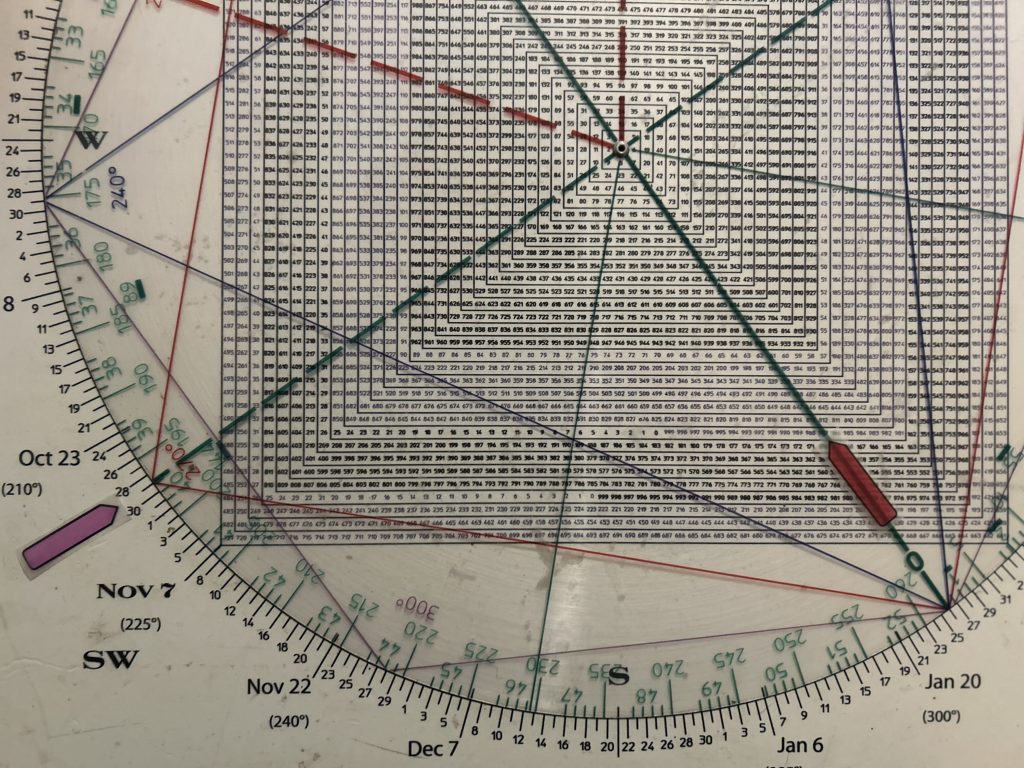
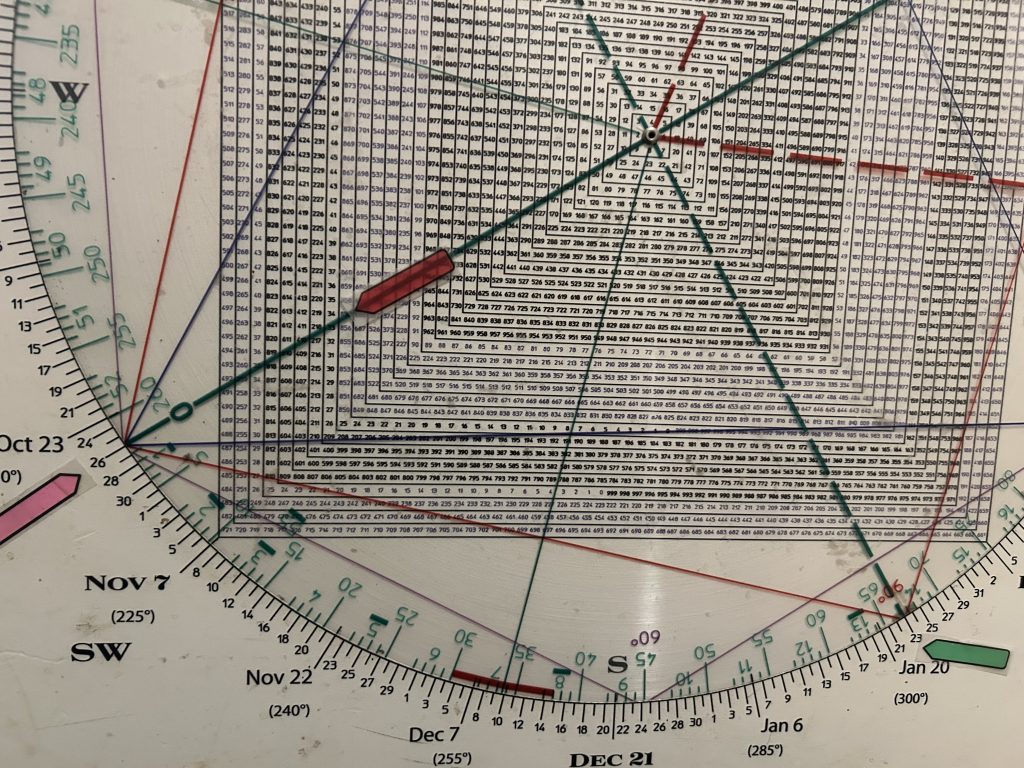
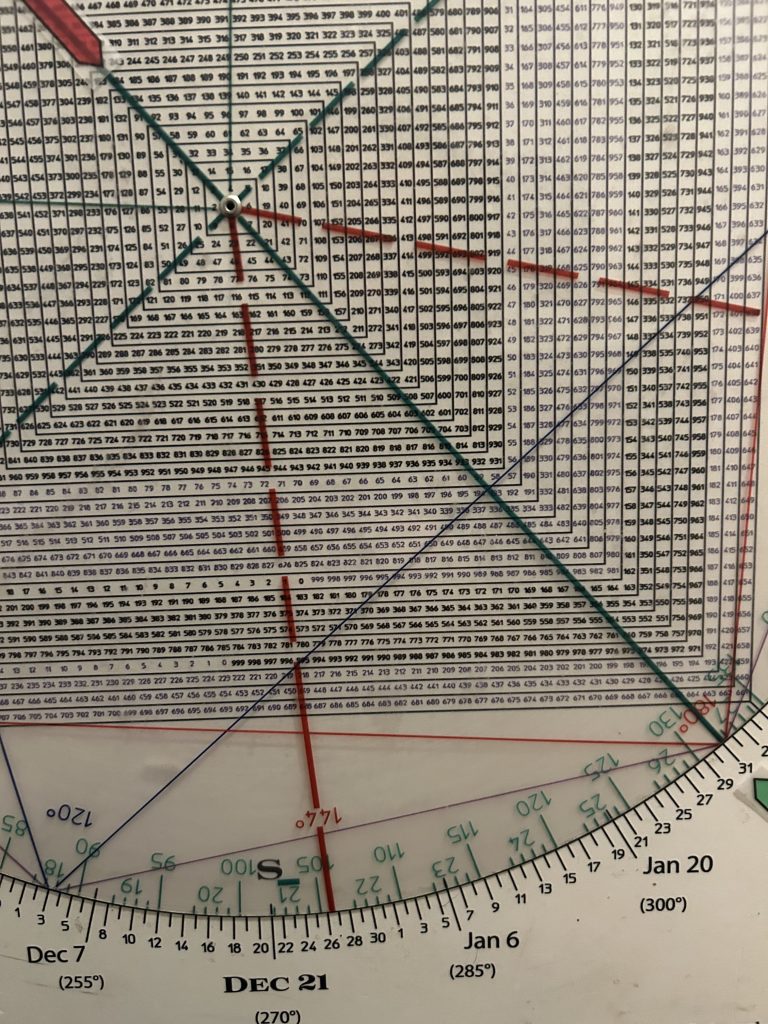
Be that as it may, the Square of 9 Wheel of Time & Price demonstrates that as W.D. Gann stated,
vibration explains every possible phase and condition of the market:

Square of 9 Wheel
Purchase your own Square of 9 Wheel. Shipping to US only. Contact Jeff for shipping outside the US.
“After exhaustive researches and investigations of the known sciences, I discovered that the Law of Vibration enabled me to accurately determine the exact points to which stocks or commodities should rise and fall within a given time. The working out of this law determines the cause and predicts the effect long before the Street is aware.” W.D. Gann
Let’s take a look at the two most infamous crashes, October 28-29, 1929 and October 19, 1987.
In order to have a crash you need to have had a bubble. Both those crashes were preceded by a bubble and a blow-off, 1929
The human mind is predisposed to seek pattern s and meaning in seemingly random events, but there is clearly a phenomena going on in the above charts.
There was a solar eclipse on November 1, 1929 and a lunar eclipse on Nov 16-17, near the closing low on November 13th.
In 1987 there was a solar eclipse on September 23rd and a lunar eclipse on October 7th.
In 1987 the DJIA had pulled back off its August 25th record high into a low on September 22 where it rallied sharply, approximately 4%.
The momentum led many market participants to believe a new up leg was on the table.
The rally peaked on October 2nd.
When the market snapped the September 22nd low and the solar eclipse point, the crash was on.
So there was that thread in common.
However, when you analyze the time and price links between those two crashes using the Square of 9 Wheel you see compelling synchronicities.
1) The DJIA price high in 1929 is 386.
386 squares out with October 19—the crash day in 1987.
2) Using the number 1929 on the Square of 9 as a year instead of price shows that 1929 squares out with late August…the top in 1987.
3) Using the number 1987 on the Square of 9 as a year instead of price shows that 1987 squares October 29.
So the year 1929 squares-out with the day of the crash in 1987 and the year 1987 squares out with the day of the big crash in 1929.
How is this possible?
The Law of Vibration perhaps triggered by eclipse points.
The SPX high on August 25, 1987 prior to the crash was 388.
388 is opposite September 3 on the Square of 9 Wheel…September 3 being the pre-crash high in 1929.
In these two examples it would appear that there is something going on that trumps Efficient Market Hypothesis which posits that asset prices reflect all available information, rendering attempts to forecast market movements futile.
It is easy to dismiss the potential significance of celestial influences on human affairs but the Dept. of Neuroanatomy at Yale Medical School discovered that the human nervous system typically undergoes measurable perturbations during the Spring and Autumnal Equinoxes.
The big picture is one thing but as traders we live and die by the short term sword…especially when it comes to options.
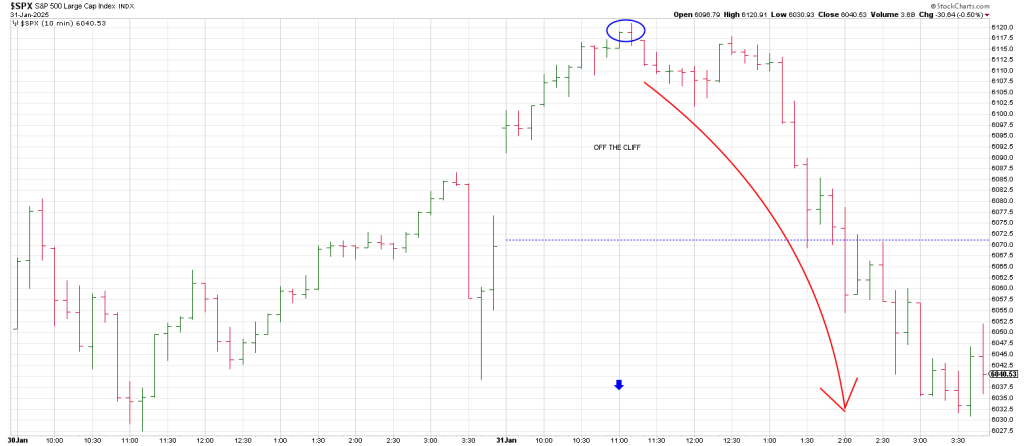
On Friday morning on the Hit and Run Private Twitter Feed we posted that our Roadmap projected a spike top at 11:00 ET and off the cliff.
TWEET: The Roadmap to recap today shows a rally and high for the day at 11:00 (ET) and a cliff dive
The SPX 10 min chart below shows the high for the day at 11:00.

The index went off the cliff plunging 90 points in just over 4 hours.
The Roadmap is based on fractals and short term market and natural cycles.
If the market were random, my Roadmap could not have made this call.
January 31st, Friday, aligns with/points to 602. The SPY closed at 601.82.
After filling the Deep Seek Massacre open gap, we got the cliff dive.
Friday morning’s rally was a hologram.
All the “reasons” traders could use for a rally were known knowns.
The Fed’s rate decision came Wednesday. AAPL delivered….an Earnings Reversal—opening on the high of the day at 247.19 and closing at 236.
MSFT and TSLA earnings came and went.
The Fed’s favorite inflation metric, the CPI showed muted inflation.
What was the catalyst to prop up Friday’s rally, short of OpEx Pinball play to 610 SPY?
It was a text book OpEx grenade—the pulled the pin mid-day after hitting the 610 strike.
Let’s fast forward to the big picture and the position of the market using traditional technical metrics before diving into a potential hidden message revealed by the Law of Vibration
1) The 6100 region has been on the radar for a year as major resistance. It represents a Measured Move: the low from the March 2020 Covid low to the early January 2022 top is 2626 SPX points.
Adding 2626 to the 3491 October 2022 low gives 6117.
At 6117 the SPX achieves equality with the rally from March 2020 to January 2022.
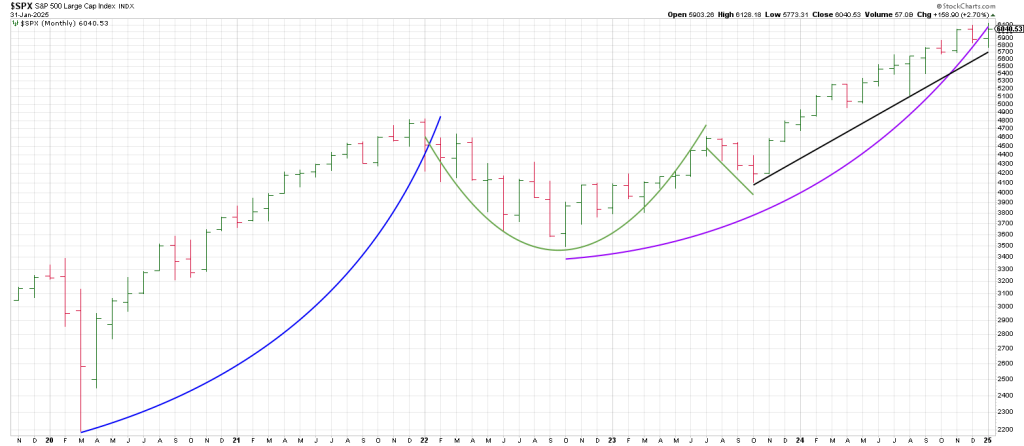
2) The SPX ‘came out’ of a monthly Cup and Handle in November 2023 after turning its 3 Month Chart down in October 2023 with three consecutive lower monthly lows.
3) A vertical move took place into November 2024 on the one year cycle.
4) The SPX struck a new all-time high in December but tailed off closing near the low of the month.
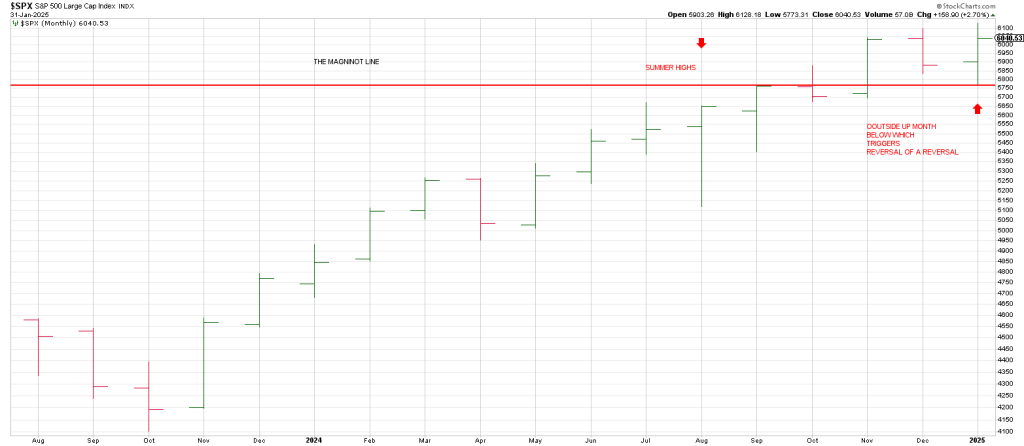
5) In January the index turned its monthlies down for the first time since August and rallied to turn the monthlies back up on January 22 perpetuating a record high close of 6118 on January 23rd satisfying a big picture Measured Move in the process.
6) Breakage below January’s low over coming weeks will trigger a Reversal of a Reversal sell signal…or what I call a Keyser Soze. In other words, January is an outside up month, a failure below January’s low that sees downside FOLLOW THRU is a Reversal of a Reversal.
The last major swing low was October 2022 at 3490 (349).
3 full revolutions of 360 degrees up is 610.
So we have this 6100 level two ways: a Measured Move and three 360 degree decrements up from the 2022 low.
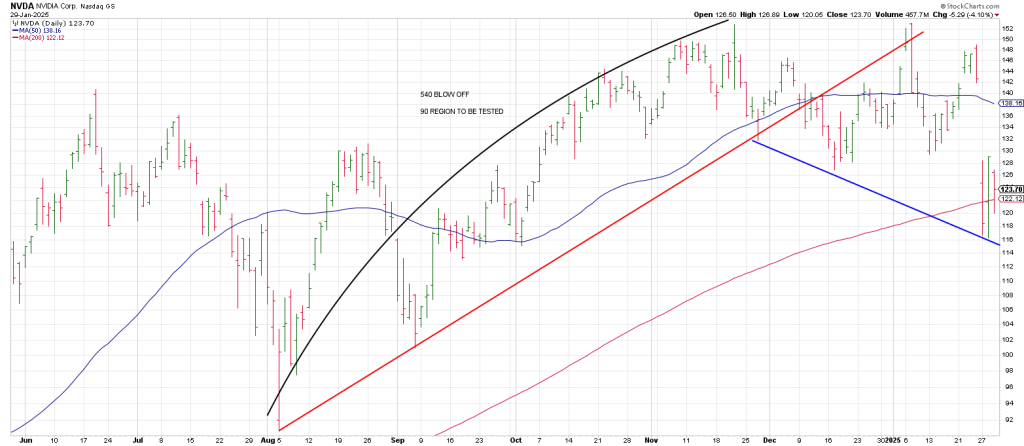
Drilling down to the dailies shows the SPX has traced out a Megaphone Top…flagged last week in this space. The downside projection ties to the 5700 region.
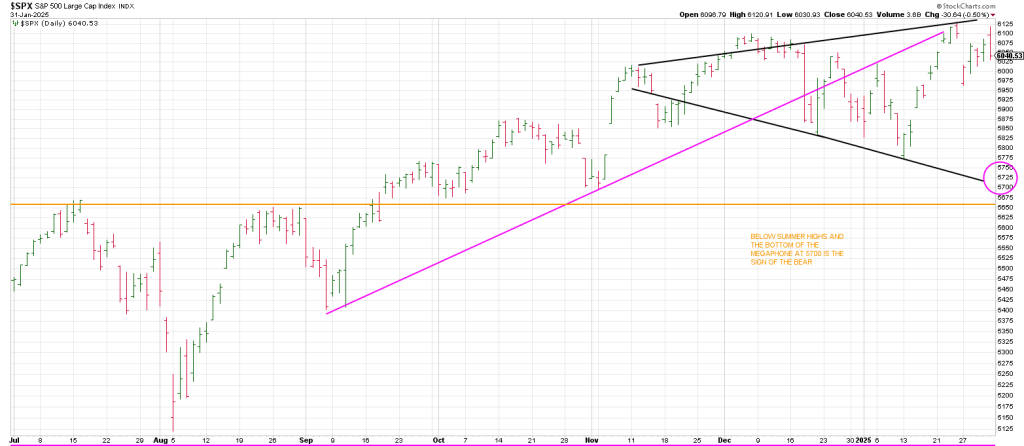
This is a key area because 5700 defines a trend line from the October 2023 low as shown on the above monthly.
Late January/early February was also projected to be a turning point:
We had a 3 day Flash Crash from August 1st through August 5th (where Hit and Run had 10 bagger plus option plays) with another 90 days/degrees out early November and the election spike.to 6017.
We are 90 days from the election and at the same price more or less.
As well we are 3 years (360 days/degrees) from the January 2022 top.
Is a financial panic going to play out this quarter?
There is a natural cycle which repeats that last did so in late 1857 coinciding with a financial panic that lasted more than a year.
1857 is 168 years ago. A Fibonacci fractal of Phi.
On the Square of 9, 168 squares out with February 9th.
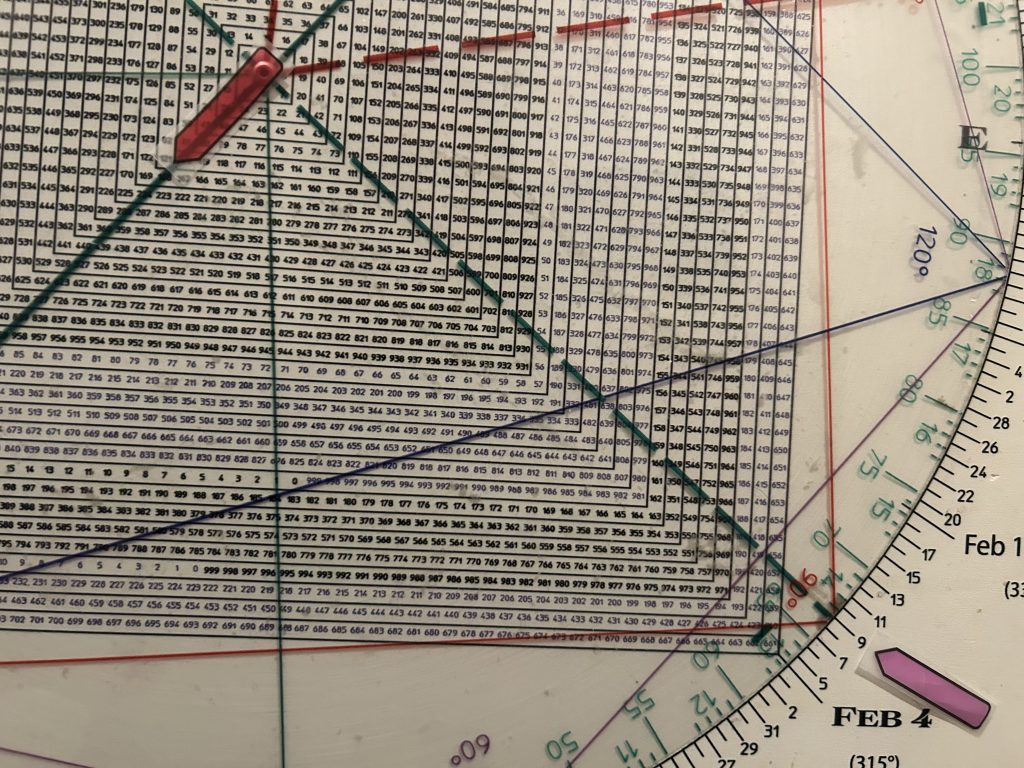
1857 the year aligns with October 26th, in the crosshairs of the October 24th, 28th and 29th crash days in 1929.
1857 squares January 23rd. January 23, 2025 is the closing SPX high.. Friday tested that high.
Tonight we are nearly 200 points off that high.
How far will the market panic?
In 1987 a gap below the 200 DMA on Friday October 17 perpetuated Black Monday.
Currently the 200 DMA resides at 5630, roughly the same as the summer highs.
That is the Maginot line.
Fittingly the SPX has not seen its 200 day moving average since October 2023.
Isn’t that what a panic does revisit the scene of the crime where the bodies are buried.
January 23rd, 2025 is the all-time closing high for the SPX so far.
Two days later we got a Massacre Gap of 140 SXP points on the open…to the 20 day moving average.
Hit and Run members were locked loaded with puts from the prior Friday.
One SPY put went from 11 cents to $5.50 on the open, a 50 bagger.
Another from around 2 to 12.
Following the Massacre we got a 3 Day Dead Cat bounce that carried over into Friday morning.
Until it didn’t
We have a lunar eclipse on March 14th.
If January 23/24 holds as the high, the Gann 7 week Panic Window opens around March 14th.
Just as 7 weeks from the September 3, 1929 peak saw a crash commence and 7 weeks from the August 25, 1987 peak saw the start of a crash.
Often investors move into precious metals as financial storm clouds gather and precious metals have been on the move,
GLD struck an all time high on Friday.
But often it is the case that when stocks get hit the metals will go down INITIALLY as investors sell what they don’t want in order to meet margin calls.
GLD has a possible turning point on deck.
After the major 150.50 GLD low in October 2022 we projected a 540 degree advance to 233.
When GLD broke out over 233 it opened the door to 249 and 264.
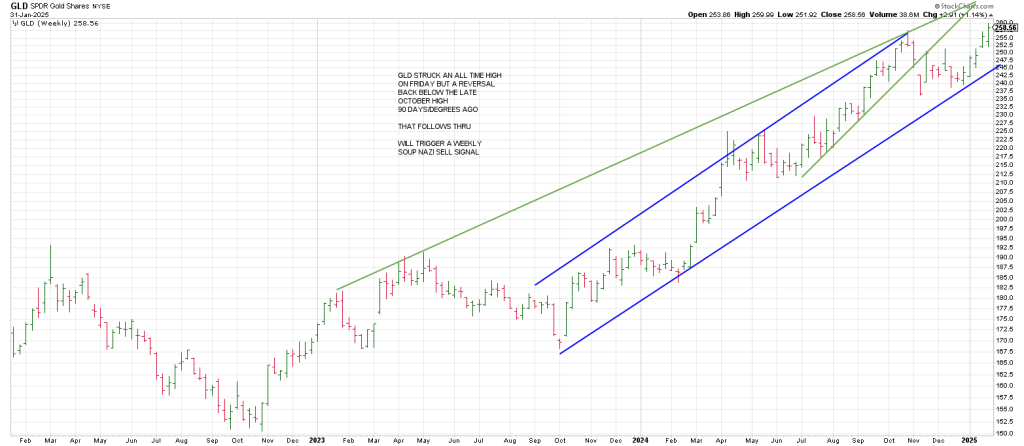
GLD got to 259.99 on Friday.
What I am watching is that the end of January is 90 days degrees from the late October peak.
Early February is also 1 year from the February 2024 low and explosion.
That February 2024 low was 184.
184 is 180 degrees straight across and opposite January 31st.
In sum several factors point to an outbreak in volatility…not least of which is that we are 5 years from the outbreak of Covid.
We know that the 5 year has defined big picture turning points in history.
1932 low to 1937 crash
1982 low to 1987 crash
1995 low to 2000 top and crash
2002 low to 2007 top and crash
Q1 2020 low to Q1 2025?
Friday’s report was titled Massacres, Dead Cats and Monkeys.
Last Monday’s Deep Seek Massacre led to a Dead Cat Bounce and Phil D Gap.
The bear Monkeys who connected the dots are smiling this morning.
They know the first mouse gets the squeeze and the second mouse gets the cheese.
Checking a daily of the lead index/ETF, QQQ, shows today’s plunge is consistent with a powerful 3rd of a 3rd wave to the downside.
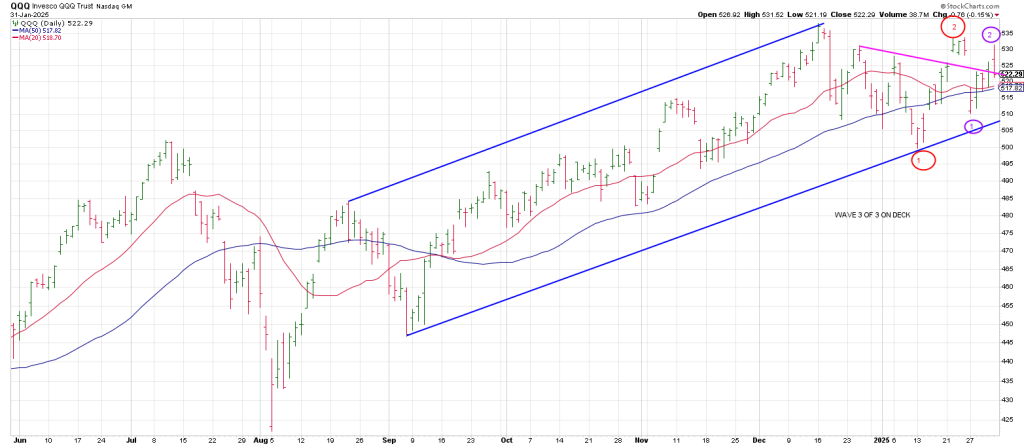
The downside pivot is a trend line connecting the September and January lows that comes in around 508 region.
The Q’s could hold this support and bounce but the presumption is that leaves a Rule of 4 Sell setup (a break of a 3 point trend line) on deck in February.
That will coincide with a genuine crash.