“Get there quick by street but not the freeway
Turn that trick to make a little leeway” By the Way, Red Hot Chili Peppers
The following is from Tuesday morning’s report:
“The SPX broke the key 5220 level on the Friday weekly closing basis last week but gaped up on Monday reclaiming its 20 day moving average.
The sharp turndown in the 3 Day Chart on Friday produced a strong rebound.
Notably, Friday’s decline also produced a break of a trend channel from April.
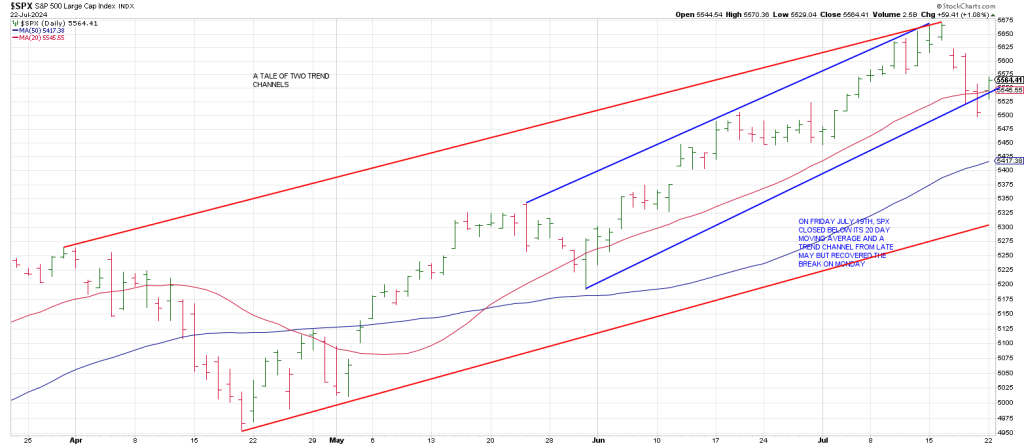
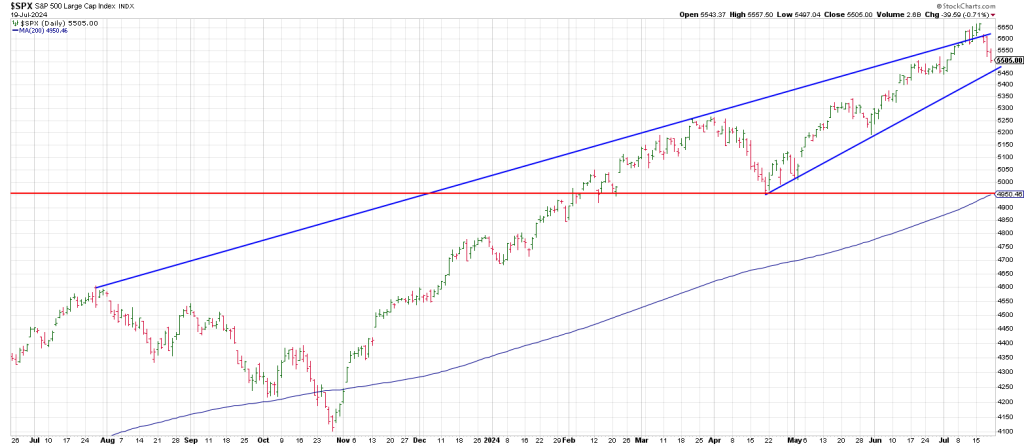
I connected the all time high with the mid-June high and the May 23rd Key Reversal Day. I then paralleled a line off the May 31st low to get a trend channel (blue).
I then connected the all-time high with the late March high and paralleled and paralleled a line off the important April low to get the red trend channel. Notice that the bottom of the red trend channel ties to the May 23rd Key Reversal Day in the low 5300 region.
The likelihood is a Minus One/Plus Two sell setup is on deck.
The idealized level for the high for this setup is the 5580 region. This is right between 90 degrees down from the 5669 all time high and Friday’s 5497 low.”
Let’s recap what my Minus One/Plus Two Sell setup is.
It revolves around my 3 Day Swing Chart Method.
3 consecutive lower daily lows (intraday not necessarily closes) turns the 3 Day Chart down.
This is the Minus One part of the method.
Once the 3 Day Chart is down, any time you get 2 consecutive higher daily highs satisfies the Plus Two part of the setup.
In the current picture, the 3 Day Chart turned down on Friday.
Tuesday satisfied 2 consecutive higher daily highs putting the SPX in the Minus One/Plus Two Sell position.
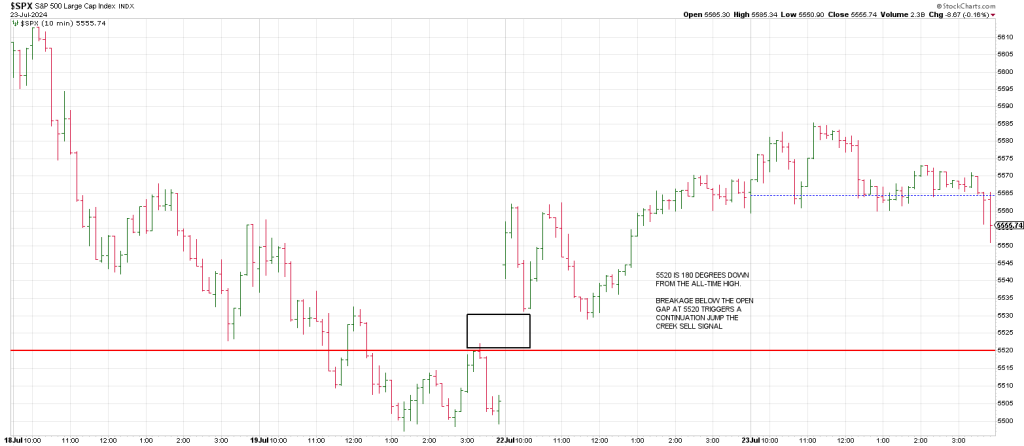
A 10 min SPX for Tuesday shows the index ‘assumed the position’ (the -1/+2 sell setup with 2 consecutive higher highs) from the get-go. We closed 35 points off session highs.
After the close TSLA reported sending futes sharply lower.
Breakage below the blue trend channel on the above daily SPX opens the door lower.
It sets up as a textbook case of the 1st mouse gets the Bear squeeze and the 2nd mouse gets the Bear cheese.
In other words, the first break of the trend channel on Friday produced a squeeze.
The second time thru, the second mouse, will get the cheese for the bears.
Specifically the cheese looks like the 5371 region.
This is 360 degrees down from high and ties to a test/undercut of the 50 day ma.
Importantly, a drop to 5371 breaks a rising trend line from the April low, so there is a strong likelihood if this plays out that a full 540 degree price decline off the all time high is on the table targeting 5226.
Notice how 5226 is an undercut of the red trend channel from April.
To put this in perspective, a drop to the 5226 region does not even reach the May 31st low.
However, it does fully test the high of the May 31st LROD (large range outside up day).
In sum, Time & Price harmonics indicate the potential for panic into the end of July.
July 30th squares out with October 29th, the Great Crash in 1929.
Late July aligns with 92. July is the 92nd anniversary of the panic low in 1932.
July 30th is opposition the year 1987 which of course saw panicky selling as well.
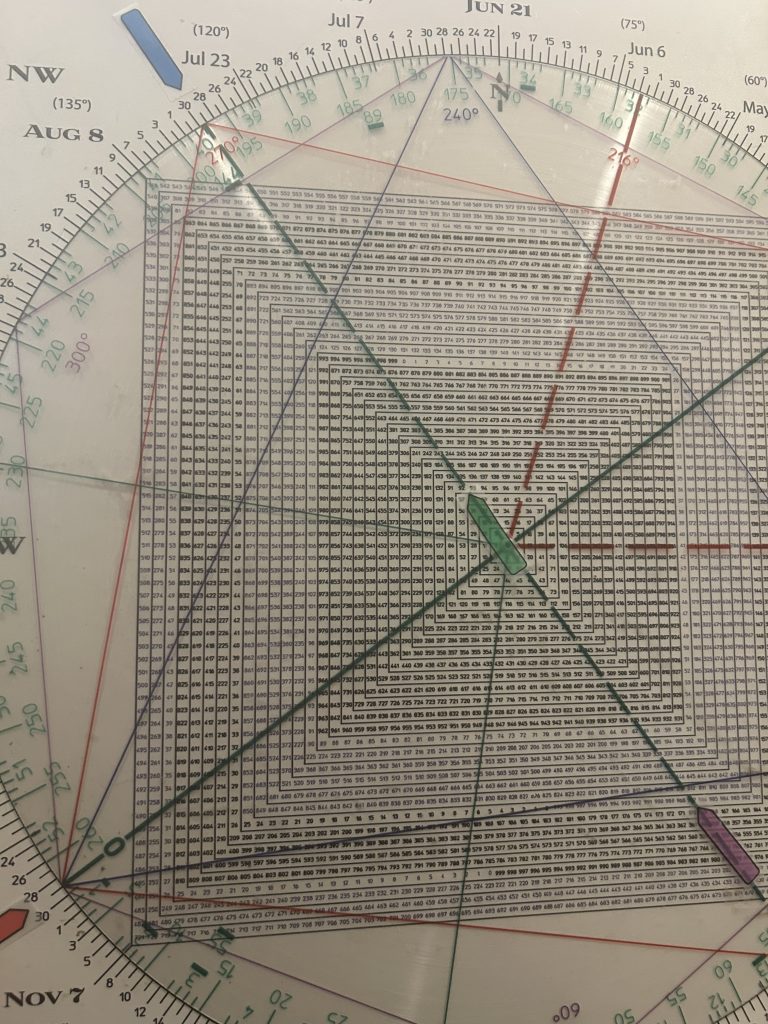
July 30, blue
October 29, red
92, green
1987, purple
If the market gets through the end of July relatively unscathed, we have assessed when a Selling Panic is in the cross-hairs somewhat later in 2024.
Bottom line—the back of the blow-off has been broken, whether we get a return rally or nominal new high ala 2007 is not the issue. The question is when the crash bursts.
Below is a daily SPX from Monday’s report. Breakage below 5450 opens the door to the freeway to April low and the 200 day moving average which hasn’t been seen since October 2023.
The news breaks with the cycles, not the other way around.
We’ve had a remarkable series of black swan news events in the last week or so anyone of which could upend markets.
Will a flock of black swans collide with a fleet of Hindenburg’s?
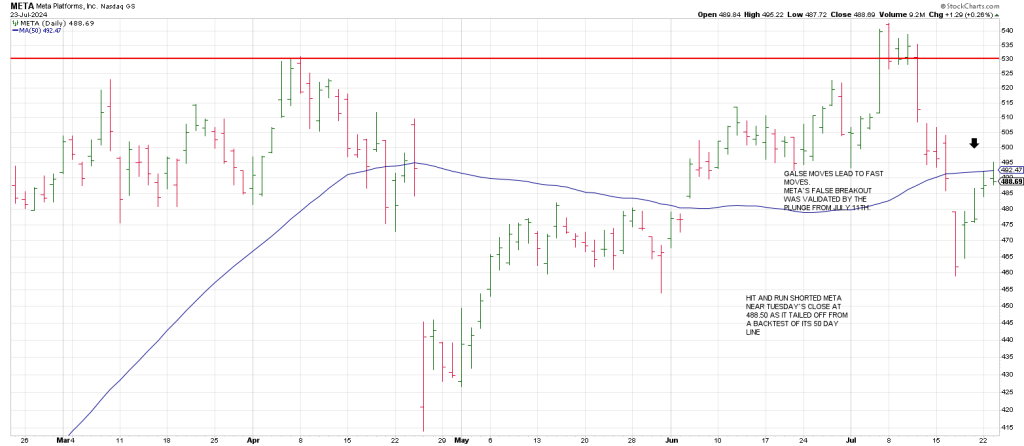
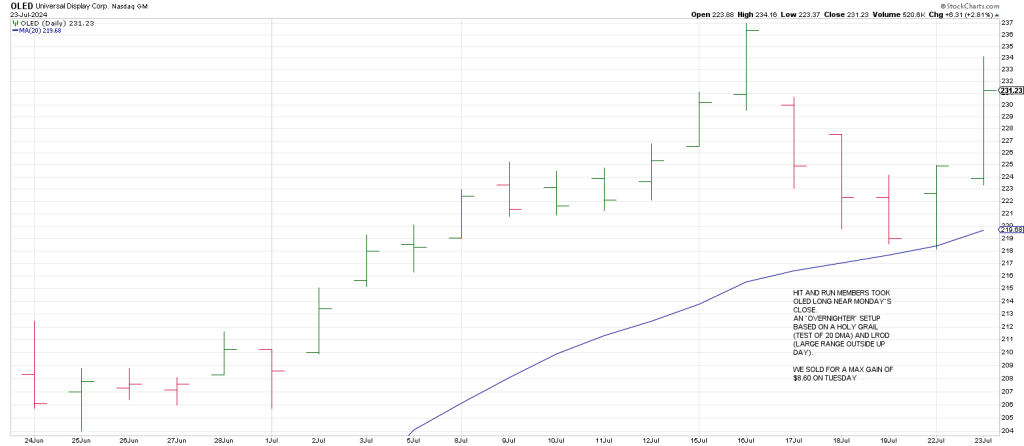
Hit and Run Tape Reading