“Ah, the boat, yeah,
You know they’re still
Rockin’ it
And the truth, well,
You know there’s no
Stoppin’ it” The Denial Twist, White Stipes
“Investors should be cautions because bullish sentiment and stock market valuations are high by historical standards.” Warren Buffet
Despite indices finding an opening high punctuated by two sharp declines intraday, and a DJIA finishing sharply lower down 398 points, market internals told a different story.
The NYSE closed with net advances of +194, reflecting resilient participation beneath the surface.
It looks like selling pressure is contained —for now…except for two things: Pattern and Cycles.
The glaring disparity in the market is perfectly defined by the weakness in software names versus the strength in other go-go glamours.
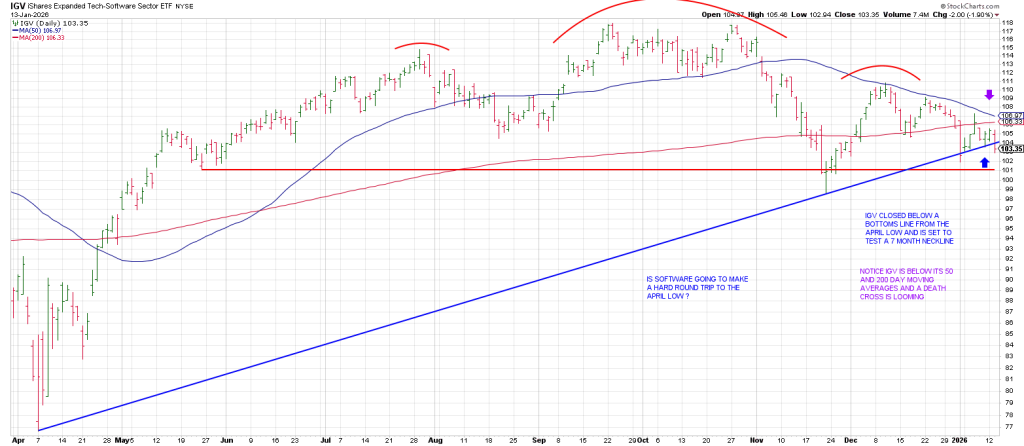
IGV the software ETF looks set to test its November 21st low.
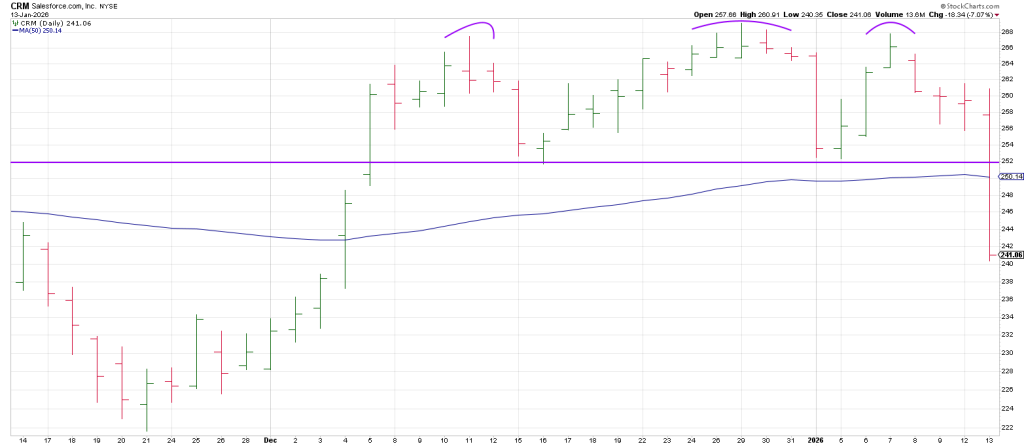
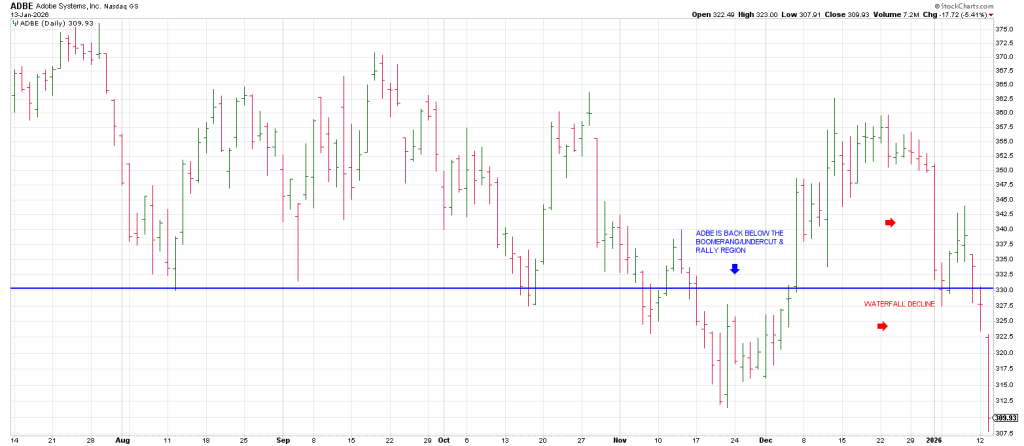
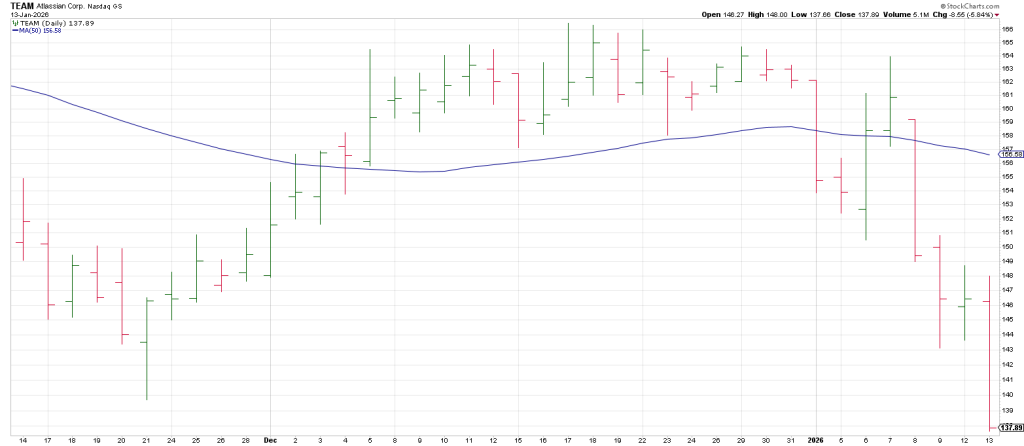
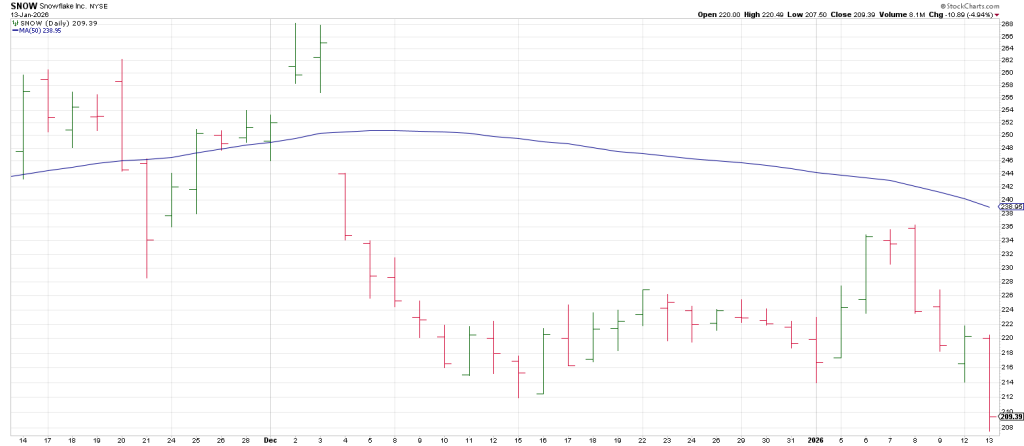
Weakness in software was led by CRM, ADBE,TEAM and SNOW to mention a few.
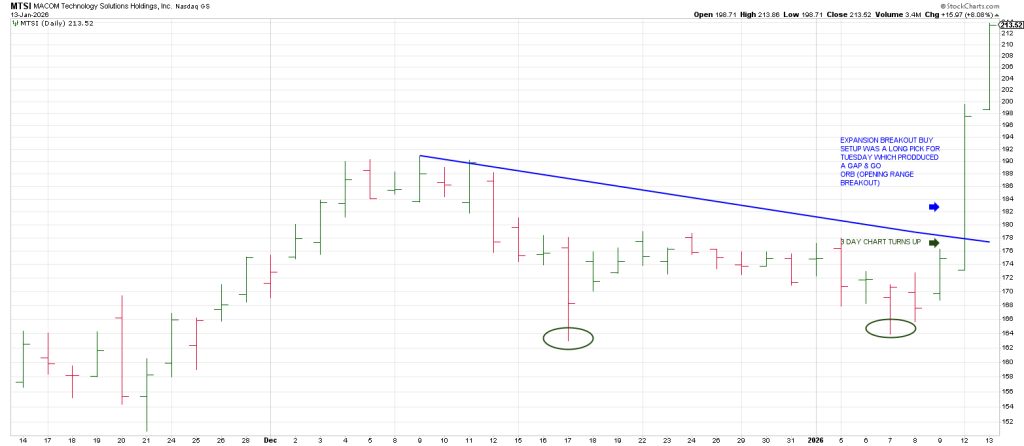
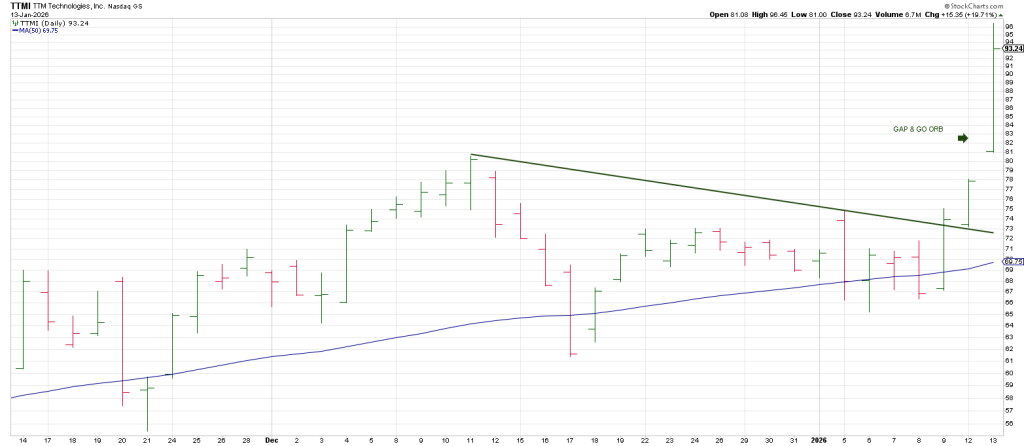
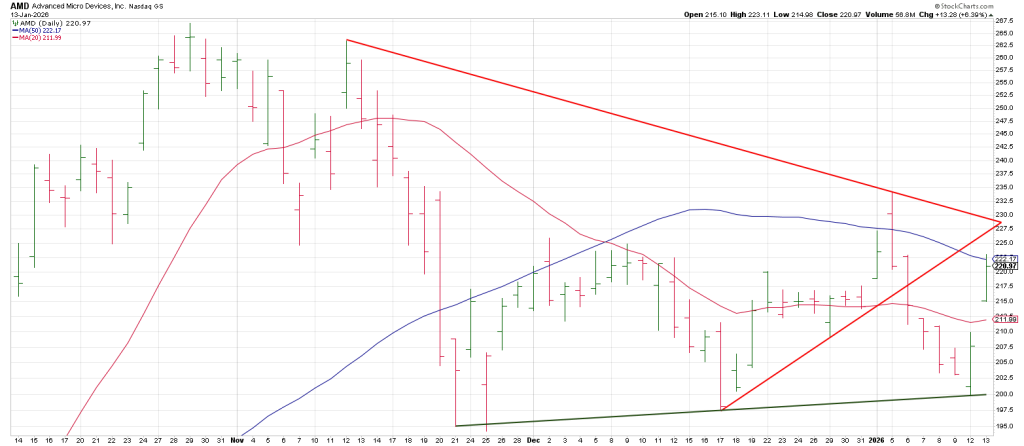
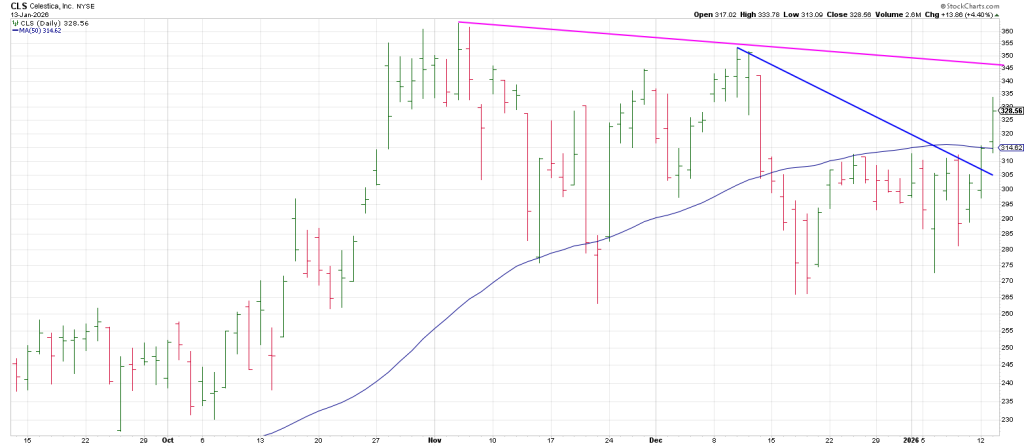
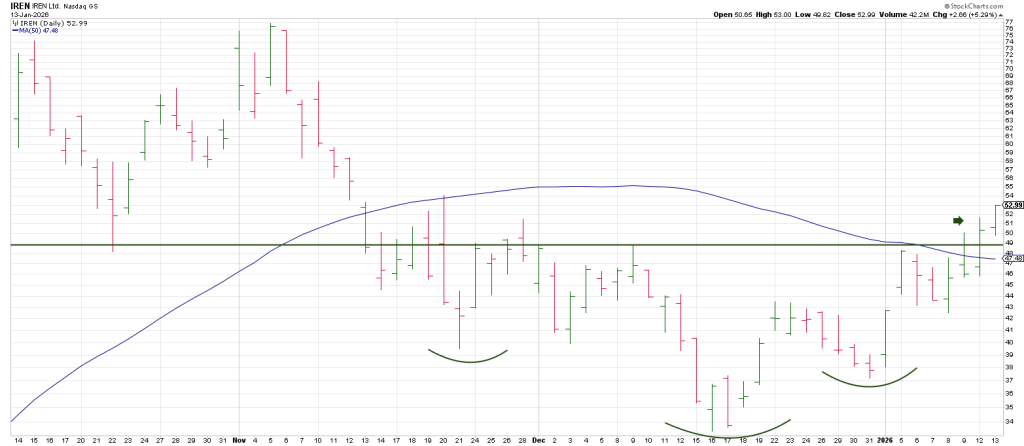
In contrast, several names shrugged off market weakness and rallied sharply from the get go.
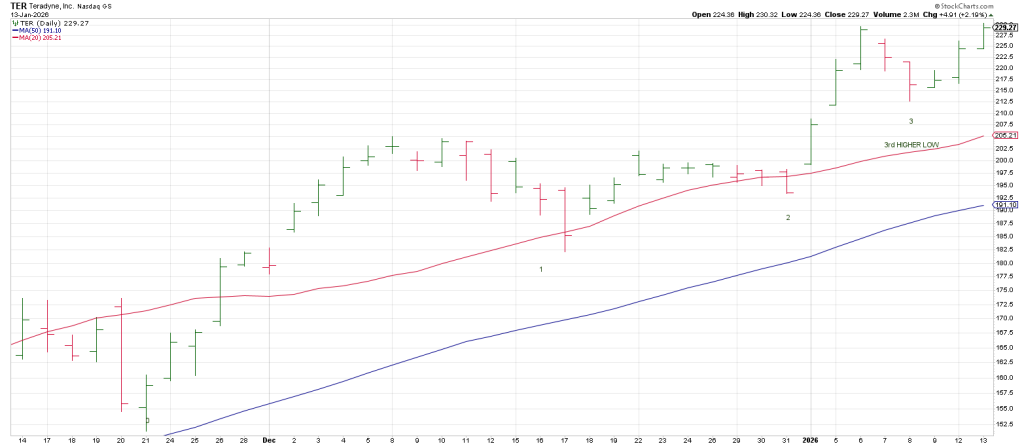
Names include, MTSI, TTMI, AMD (for a change), TER, CLS and IREN to mention a few.
Whether the internal strength argues for a challenge of the 7000 SPX “round number” or we should know today.
Natural cycles should exert their downside influence today with a potential Pause Day tomorrow and down again on Friday.
As well the SPX has carved out a micro (10 min basis) pattern of 3 lower highs.
Fast declines often times show up after 3 lower highs….and vice versa, sharp rallies often show up after 3rd higher lows. This can occur on all time frames.

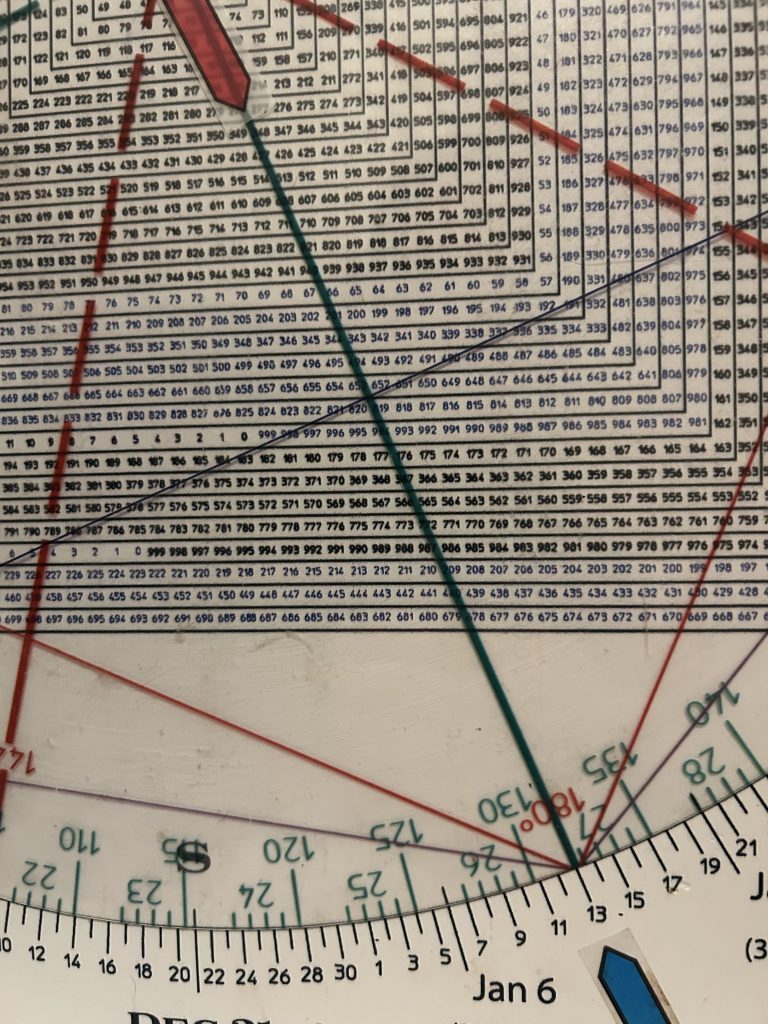
There is also a potential Time/Price square-out on the table:
The October 2022 SPX 348/349 low (3480-90) is direct/points to January 13.
This price also vectors the March 2020 crash low 219 (2190).
This is very important as it is the last major low.
Months ago we flagged the 703 to 710 region (7030 to 7100).
This above square-out vectors a price of 7100. Theoretically the strong internals could be calling for a last hurrah to 7100.
Further 712 squares April 7—the 2025 low.
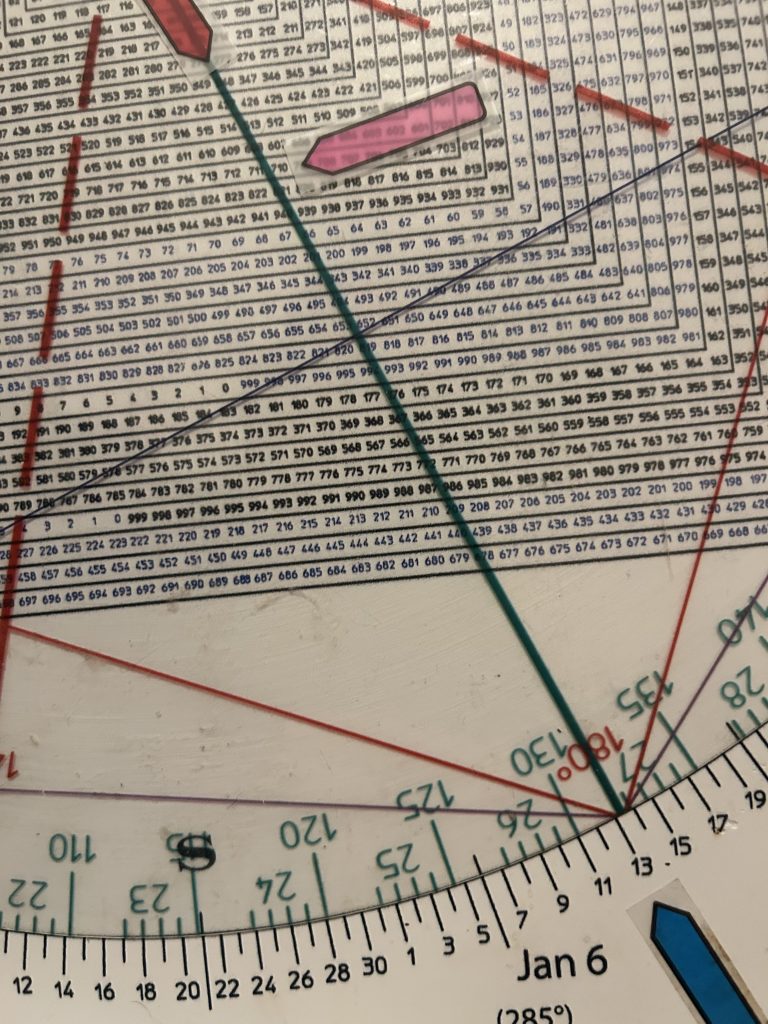
703 squares the YEAR 2025.
Monday the SPX struck an all-time high of 6986
698 points to February 19.
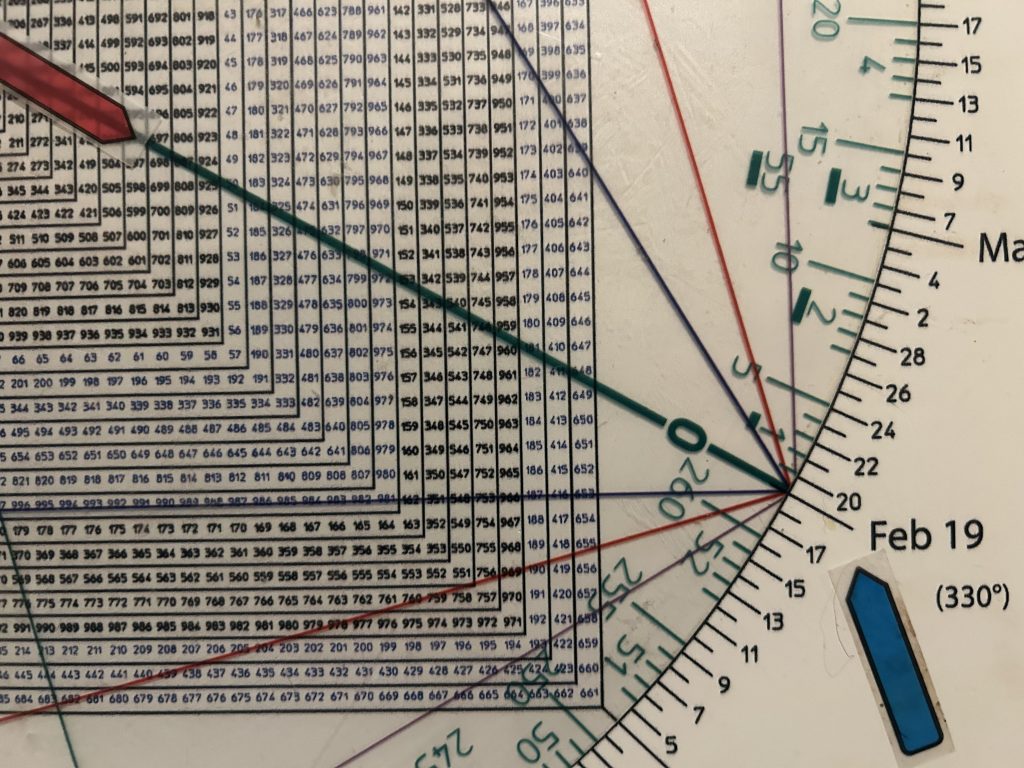
This was the pre-crash high in early 2025.
February 19 also marked the pre-Covid Crash in 2020.
Remember that late this week is opposite 386, the high in 1929.
We may be ‘there. This 6986 level resonates off two pre-crash highs. Essentially the SPX has hit the “round” number 7000.
7 the number of Time.
How will we know?
1) Break of first support at 6890-6900.
This is the 3 point Bottoms Line From the Nov 21 low
2) Further confirmation will come on a break of the 20 week moving average at 6755 currently.
3) That would have us looking for a drop to the 6100 region and the February 2025 high which amounts to an undercut of the 50 week moving average (which ties to the 200 day ma which has not been seen in 8 months.
Short of all that we may see a Final Twist.