“Through their own words
They will be exposed
They’ve got a severe case of
The emperor’s new clothes.” The Emperor’s New Clothes, Sinead O’Connor
“There is no such thing as a riskless hedge against inflation.” Edgar Fiedler
On only the third day this year, on Tuesday the NYSE registered net advances.
The exchange managed a respectable 1424 more advances than declines following the PPI report and Monday’s reversal day.
The NAZ ended the session with half that many advances.
As well, both indices ended the day below the open.
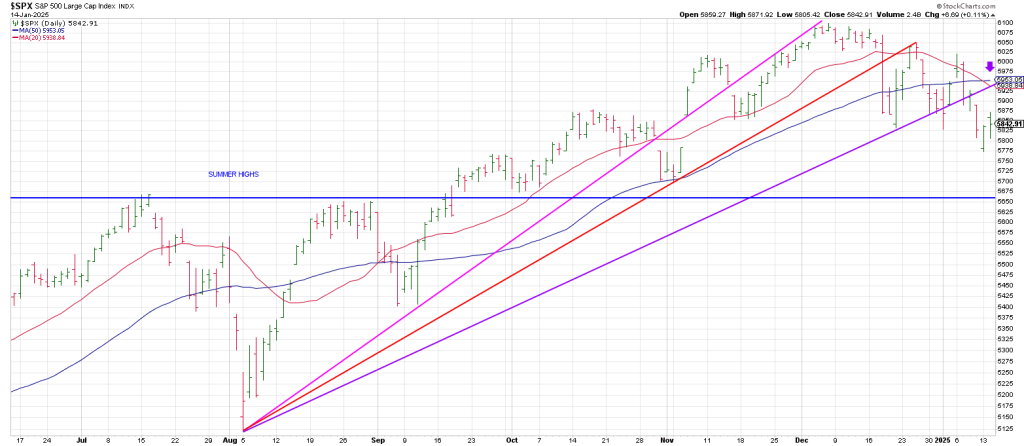
The SPX reversed after rallying to 5871 just 11 points above the projected 5860 square-out level (270 degrees down from the all-time high).
My December Indicator flashed a warning for 2025 when the SPX closed below its December low in January. This occurred on January 10th.
Interestingly, the SPX closed at that level.
The 3 Day Chart is pointing down.
Tuesday the SPX traded above Monday’s high.
Trade above Tuesday’s high today puts the index in the daily Minus One/Plus Two sell position.
I drew a trend line (magenta) connecting the August low with the first pullback low in early September.
That Ghost Line (a line extended into the future that seemingly doesn’t exist but exerts its presence.) nails the December 6 all-time high.
I drew a second trend line connecting the August low with the second pullback low in early November. Bearishly that Ghost Line nailed the Secondary High in late December.
I drew a third trend line connecting the August low with the December low…on December 20.
That Ghost Line intersects a Bowtie of the 20/50 day moving averages over coming days.
I don’t know if the SPX can get there, but if it does it should be a lay-up short with the convergence of the overhead 20 and 50 day moving averages and the Ghost Line.
That said the SPX is under pressure based on 3 lower swing highs.
Fast declines often follow 3rd lower highs, what I call a Power Surge sell setup.
The next turn lower in the SPX targets the summer highs, the July and August high at 5660 and 5650 respectively. This ties to 540 degrees down from the 6100 peak.
The index should get magnetized to that region.
The summer highs represent prior resistance.
Prior resistance should act as new support.
If it does not act as support it will be another feather in the Bear’s cap.
The NAZ traded below its December low on the first trading day of 2025 and closed below the December low on Friday, January 10.
Trade above yesterday’s high today threatens a potentially bearish backtest of the 50 day line.
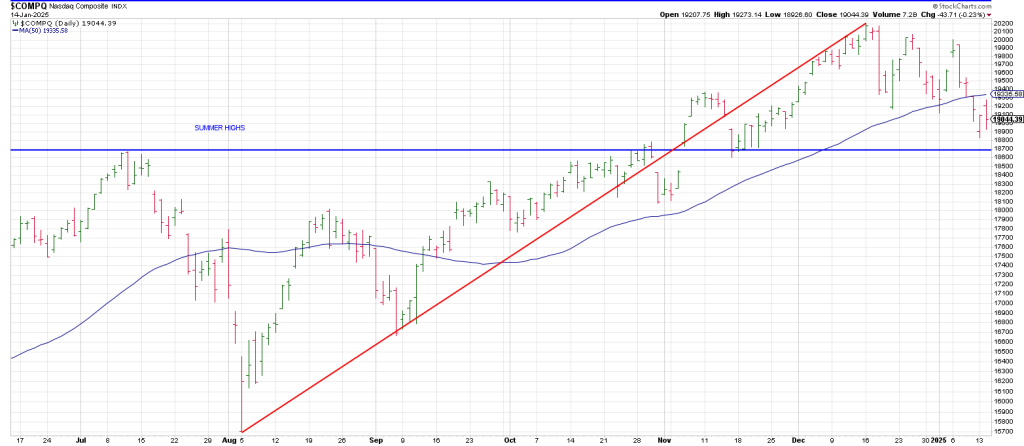
Notably the NAZ 50 day line corresponds to the Lightning Rod (LROD or Large Range Outside Down Day) on December 18th.
A failed rally from this juncture in the NAZ carves out a 3rd lower high.
The NAZ is already testing its summer high, the July peak.
A Ghost Line from the NAZ August low nails the Right Shoulder of a Head and Shoulders Top formation.
Notice the downside acceleration following that ‘hit’.
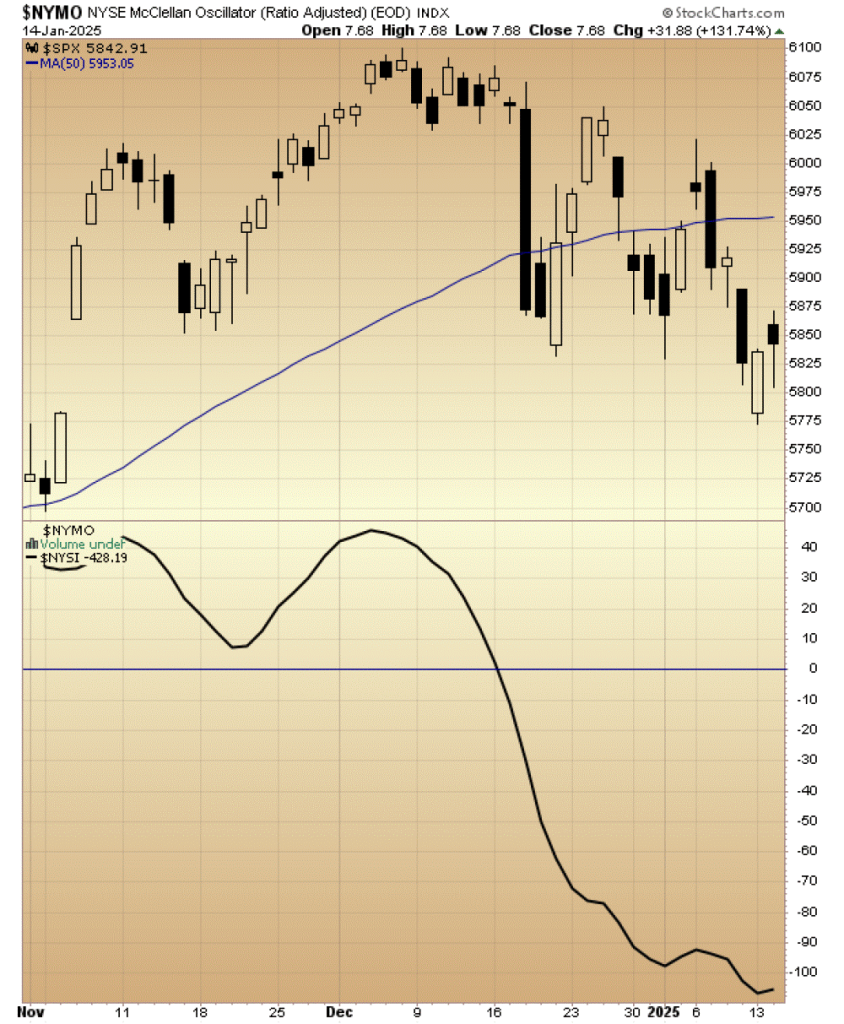
The bearish internal complexion of the market is reflected by the NYSE Summation Index driven down by over 800 points since December 31st, 2024.
A short term bounce aided by “favorable” inflation reports would not be a surprise.
Be that as it may, we must be mindful that the Gann Panic Window does not even open until next week, 49 calendar days from the December 6th high.
Keep in mind the market is not a Rolex; downside acceleration could occur at any time but the brunt of the selling should be in the Gann “window”.
As well historically, the window for upside is typically capped in this formation around the 40th calendar day from high which ties to today (+ or -).
Can the market get upside traction off the heels off a favorable CPI this morning?
The stake in the Bull’s heart is NVDA.
NVDA left Combo Sell Signals on January 7th.
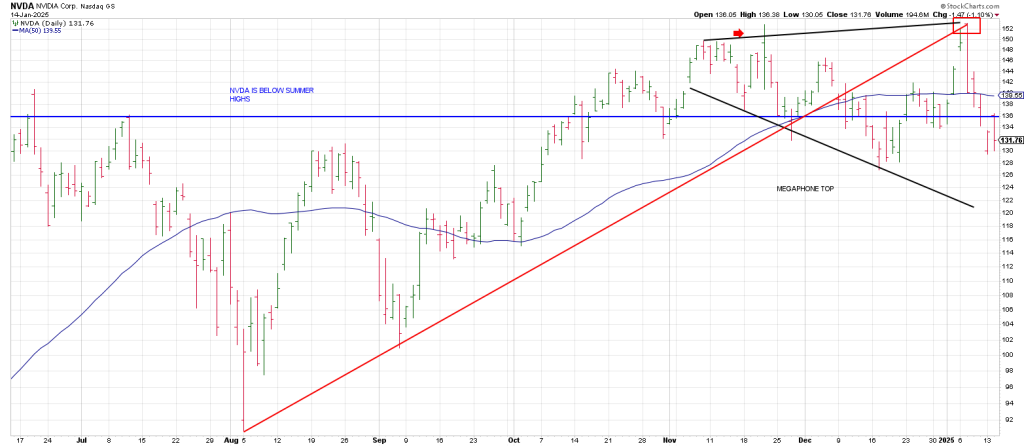
On Jan 7, NVDA gapped open to a record high following the CES conference where Jensen spoke.
We suggested that it would be a “buy the rumor, sell the news” event.
The open was the high with NVDA reversing dramatically leaving a Key Reversal Day…a new 52 week high with a close below the prior day’s low.
2 days later NVDA closed under its 50 day moving average.
That must have set the land speed record for a drop from a record high to below the 50 DMA.
Indeed NVDA’s drop from its record high on January 7 of 153 tested its 50 day line the same session at 140!
NVDA turned its 3 Day Chart down directly off a record high and continued lower, bearish price action.
NVDA also sports a 5 point Megaphone Top.
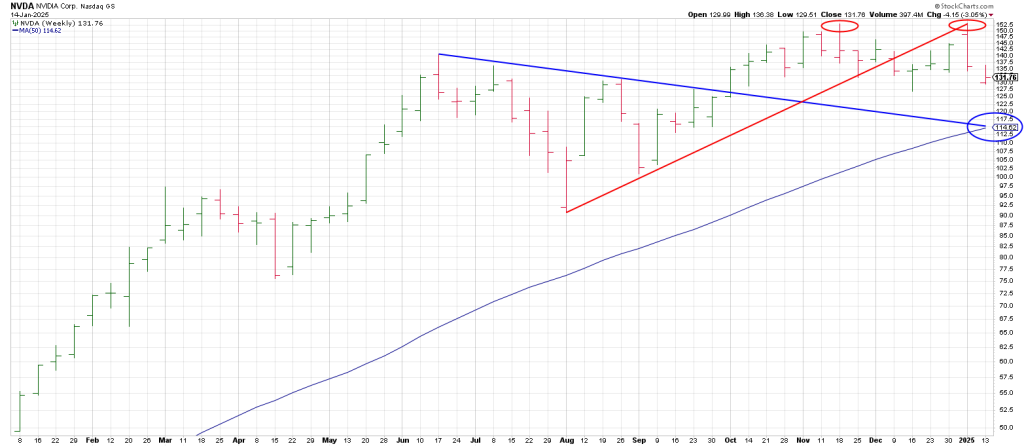
Let’s check the weeklies.
Last week NVDA left a weekly Soup Nazi sell signal.
Why?
It struck a new 20 week high but reversed below that high with at least a 4 bar interval/separation (defining a test versus continuation) but within the 20 week look-back.
Notably last weeks reversal was a test failure of the prior weekly reversal from mid-November…
SEVEN weeks later. The Gann Panic Window shattered NVDA into shards.
Last week on the private twitter feed we posted that the August low at 90/91 was a Time/Price square-out.
91 aligns with August 5th.
Image coming soon
157 “cubes-out” the 91 low as it is 540 degrees up.
NVDA caved in from 153, failing to kiss 157.
360 degrees up from the 91 low is 133.
Notice how NVDA is trying to hold that region.
Why?
360 degrees down from the 153 high is 129.
On Monday, NVDA struck a low of 129.51.
You can’t make this stuff up.
Breakage below 129 opens the door to 118 and a test of the 200 day moving average.
NVDA hasn’t seen its 200 DMA since January 2023.
AAPL also too the fast track on its descent below its 50 DMA from a record high from a Christmas high.
META is perched on a triple bottom at its 50 day line. I don’t believe in triple bottoms.
AMZN shows a possible 3 Drives to a Low at its 50 DMA.
GOOG is well above its 50 DMA but sports two Topping Tails threatening a Double Top.
MSFT is below its 50 AND 200 DMA’s.
TSLA, having left a Holy Grail sell signal on Tuesday, is perched above its 50 DMA after leaving a Key Reversal Day on December 18th.
The Mag 7 are a split decision, but remain a source of funds for the passive, sedated trade in 2025 as warned by the December Indicator… it’s hard to hold a candle to the competition offered by near 5% risk-free yields.
Sometimes risk is just risk and can’t be hedged.