“Well it’s been building up inside of me
For oh I don’t know how long
I don’t know why
But I keep thinking
Something’s bound to go wrong.” Don’t Worry Baby, The Beach Boys
“Any explanation is better than none. Because it is at bottom only a question of wanting to get rid of oppressive ideas, one is not exactly particular about what means one uses to get rid of them: the first idea which explains that the unknown is in fact the known does so much good that one ‘holds it for true.’” Friedrich Nietzsche
“How about if I sleep a little bit longer and forget all this nonsense.” Franz Kafka
The smart money hates the current market.
Why? Because it is not based on anything…but momentum and the attending performance pressure considerations money managers face.
In short, the market has been hijacked by the passive trade…the idea of passive fund flows and how they built the market into this sand castle it’s become.
What dominates the market during this last bull market from 2009 is passive, versus active management,
When the levee breaks, we all know what the flood does to sand castles.
To give you an idea of the shifting sands that lie beneath, 30 years ago passive was about 1% of market share.
Today, it is north of 50% of all assets in US equity markets.
The passive concept is that you always hold, you are always adding.
If you’re always going to hold it means you never trade. You cannot get into the market, you cannot get out of the market.
But as the Bible says, there is a time to sow and a time to reap.
There is a time to buy and a time to sell.
Because long bull markets disabuse investors of this truth makes it no less true.
It’s Cheech and Chong meet Nietzsche and Kafka.
There’s not much to talk about, just a long inhale.
In sum the market has been lobotomized.
The passive market says: “did you give me cash, then I buy.”
Any semblance of valuation or any other filtesr has been removed.
There is no restraint: money IS momentum.
This is why a little fact that being at the highest level of valuation is history is not a factor in the money that funnels in good, bad or indifferent…every day.
Rising valuations become their own rationale.
The more players are enthusiastic or should I say careless about valuations the higher the valuations go because the market has shrugged off the risk of higher valuations over time and gets bid up on every shake-out.
Mr. Market is The Comeback Kid.
In a nutshell, pun intended, this is why you find inflows from retail swamping those from active managers since April. Because smart active managers have no interest in owning equities at these valuations, but they have been slowly getting shoved in due to performance considerations.
If after a presumed correction, momentum shows up again, active managers may be stampeded into the market rather than miss the bandwagon producing a blow-off of blow-offs.
As long as the economy remains afloat, this passive trade continues to get inflows.
But as soon as a recession rears its head, the mother’s milk of the passive trade, cash flow, from an employed public, will evaporate.
As employment falls, cash flows are going to deteriorate.
What’s interesting is that the raison d’etre for growth, AI, may be the vampire that sucks employment out of the economy.
The Fed lowering rates is not going to turn the tide of swelling unemployment courtesy of AI.
Unmployment is a lagging indicator, so we could be well into a recession before it becomes apparent that the money trickling out the door becomes a torrent.
The levee breaking could be consistent technically with the Ending Diagonal or Rising Wedge shown in a monthly DJIA from 1929 as drops out of these diagonals are violent.
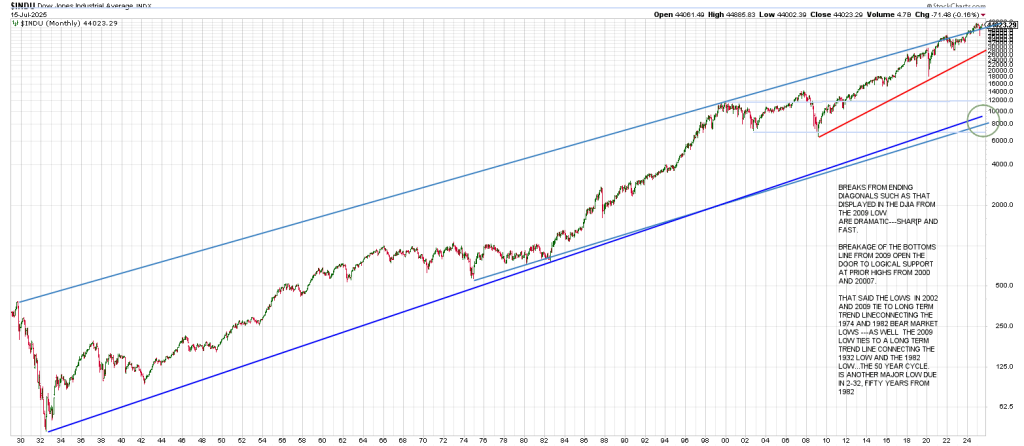
The Ending Diagonal is produced from a Tops Line connecting the 1929 high, the 2000 high, the 2021 high and the current time frame.
The bottom of the diagonal is the red Bottoms Line connecting the 2009 bottom and the 2020 low.
Breaks from Ending Diagonals are dramatic—sharp and fast.
Breakage of the Bottoms Line from 2009 opens the door to logical support at the prior highs, the double top from 200 and 2007.
That said, the lows in 2002 and 2009 tie to a long tern trend line connecting the 1974 and 1982 bear market lows.
As well the 2009 low ties to a log tern trend line connecting the 1932 low and the 1982 low…the 50 year cycle.
Is another major low due in 2032, fifty years from 1982?
In sum, the DJIA has Pinocchio’d the Tops Line from 1929 in January/February 2025 followed by a knife back below the Tops Line.
The DJIA is struggling with to recapture and hold the big Tops Line from 1929, but another sell-off warrants caution suggesting the second mouse is getting the cheese for the bears.
An epic move is on the table. We think we have a good idea when it unfolds.
For now, if you count the continued sell-off after hours Tuesday, the SPY left a Key Reversal Day.
This is consistent with a Time/Price square out at 6300 region and mid-July.
As offered in yesterday’s article, the QQQ turned its 3 Day Chart down on Monday.
Mirroring the action the last time this occurred on June 23, the Q’s gapped up on Tuesday.
That’s where the similarity ends—so far.
Tuesday’s up gap in the QQQ was the high of the day. It closed on session lows…contrary to the action after the gap on 24.
It’s very clear according to the methods we use to determine trend now:
A move below the current 3 Day Chart low of 551.63 from Monday is a conspicuous change in character.
Our expectation, offered Tuesday morning, is that an up gap would fade and that trade below Monday’s low opens the door to the open gap from June 24 in the 534 region.

Square of 9 Wheel
Purchase your own Square of 9 Wheel. Shipping to US only. Contact Jeff for shipping outside the US.