The 3 Day and the 3 Week Chart do a good job of defining the trend.
A turndown in the 3 Month Chart sends an extremely
Valuable information but is obviously not going to nail the top as it is a much longer time period.
Because of the spikes in the CAPE ratio shown yesterday, I want to compare the highs in 1929 and 2000 using the 3 Month Chart.
Below is a monthly DJIA from 1924 through 1933.
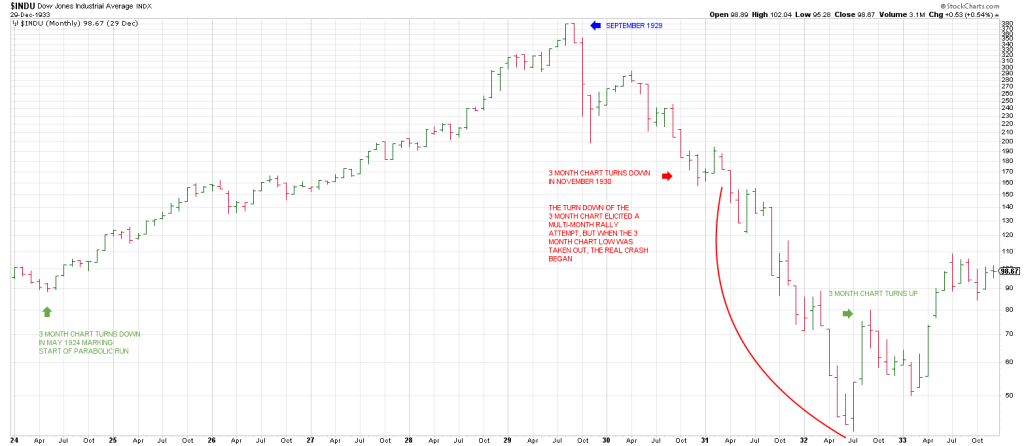
Notice the 3 Month Chart turned down in May 1924 marking the start of the parabolic run into September 1929. A period of 5 years 3 months.
Importantly the 3 Month Chart stayed up from that May 1924 low into the 1929 record high.
How’s that for a trend indicator.
The 3 Month Chart nearly turned down in November 1929, the closing low of the Great Crash.
I say nearly because the monthly Train Tracks sell signal in September just missed trading below the August low.
In November 1930 the 3 Month Chart finally turned down.
This was on the 1 year cycle from the November 1929 closing low.
The market respected that turndown going somewhat lower into December before a rally attempt during which the DJIA turned its Monthlies up in February 1931.
Be that as it may, the turndown of the 3 Month Chart in November 1930 announced a 19 month slide into June 1932. The Monthly Swing Chart turned up with an outside up month in July 1932.
As you’ve heard me say many times: when the trend is strongly down a one to two period turn up against the trend will define a high soon in terms of time and price.
The turn up in the Monthly Swing Chart in February 1931 was the high prior to a devastating decline into July 1932.
While the crash of 1929 gets all the notoriety, an absolute debacle played out following the turndown in the 3 Month Chart in November 1930.
Wouldn’t it be interesting if November 2024 marked the closing MONTHLY high of this advance.
Notice that a turn up of the 3 Month Chart in SEPTEMBER 1932 signaled a change in trend.
September being the anniversary of the high.
That turn up in the 3 Month Chart did not mark an immediate uptrend.
The DJIA pulled back to test the high of the low bar month before a genuine uptrend ensued.
The NDX/NAZ fell 78% from the 2000 top to 2002 mirrored the DJIA bear of near 90% following the September 1929 top.
So let’s take a look at the monthly NDX from the start of the FIVE year THREE month runup from the December 1994 low into March 2000.
This is the same 5 year 3 month period from the May 1924 low into the September 1929 high.
These things are right in front of our eyes, but how many times have you heard someone point this out?
Below is a monthly NDX from December 1994 through 2002.
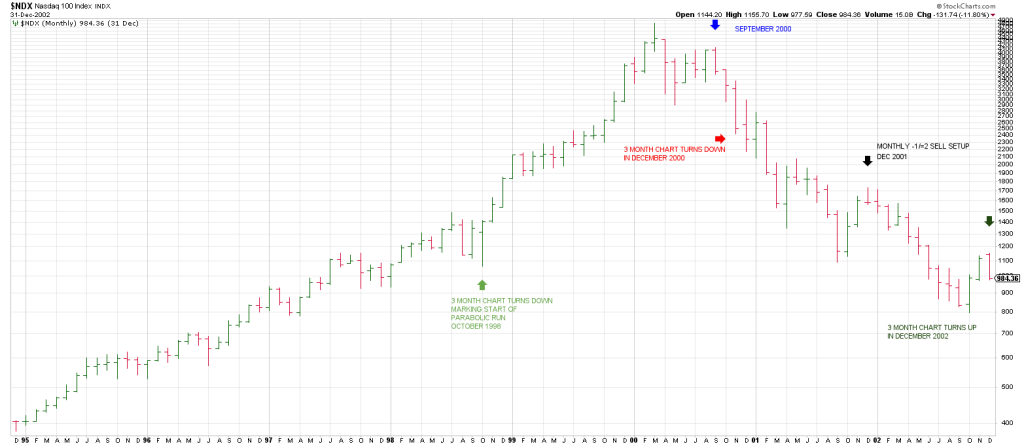
Notice the 3 Month Chart turned down in October 1998.
that turndown defined the low for the subsequent 1 year 5 month blow-off into March 2000.
The NDX 3 Month Chart turndown in October 1998 looks virtually identical to the turndown in the 3 Month Chart in October 2023.
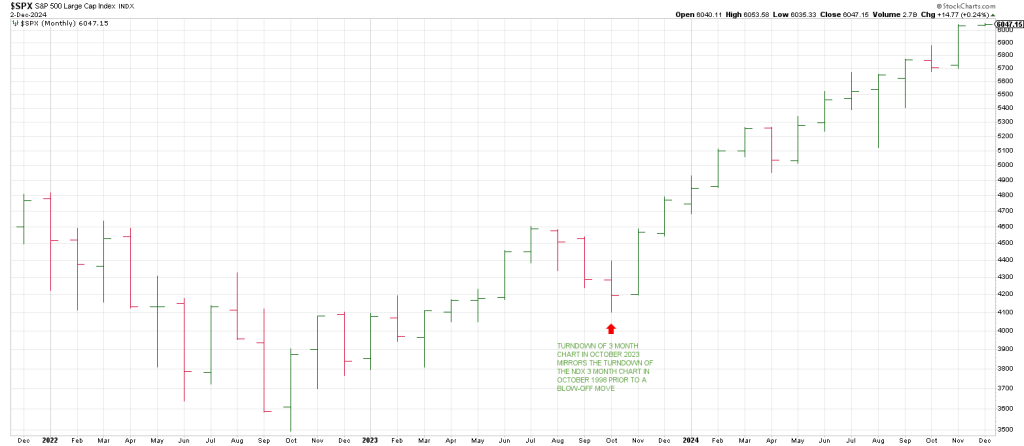
A runaway advance followed the low in October 2023.
The advance is flirting with a 50% gain.
W.D. Gann would have taken notice of this 50% advance.
On of Gann’s principles was geometric 50% retracements and advances.
The NDX turned its 3 Month Chart down off the high in December 2000 well off the high after a more than 50% decline.
That turndown perpetuated a rally attempt that could not even produce a turn up in the monthlies.
This was a testament to the powerful selling and indicated the door to the downside remained open.
Notice the Monthly -1/+2 sell signal in December 2001.
As in July 1932, the 3 Month Chart turned back up in December 2002, a year ending in 2.
Tomorrow’s report will continue with a study of the 3 Month Chart off historic peaks and the significance of this time period…particularly this week.
We must be mindful that from the September DJIA 1929 peak to the 2000 September Secondary High is 71 years.
From the September 2000 peak to the fall of 2024 is 24 years.
On the Square of 9 Wheel, 71 squares out with 24.


Square of 9 Wheel
Purchase your own Square of 9 Wheel. Shipping to US only. Contact Jeff for shipping outside the US.