Put your hand on the wheel
Let the golden age begin
Let the window down
Feel the moonlight on your skin, The Golden Age, Beck
“What the wise man does in the beginning, the fool does in the end.” Howard Marks
Last week I said I’d walk through a cycle I’d discovered.
W.D. Gann stated that his novel Tunnel Thru the Air written in 1927 contained a “mysterious and valuable secret”.
He went on to say that the purpose of the book is to demonstrate the immutable laws of nature.
Immutable laws are laws which man cannot change (even the Fed) such as change of seasons and the rotation of the planets and their GEOMETRICAL relationships to one another.
It is fascinating that the planets placement to each other follows a Fibonacci relationship.
Does the rotation and angles of planets to one another and their geometry mirror similar geometry producing timing points in markets?
There is a simple but effective means to measure price and time using what Gann called the Zero Point or beginning point.
This is when I discovered the value of the Square of 9.
By ‘anchoring’ Zero at the low price or high price and on the high day and low day, I could ‘square’ price and time.
Squaring refers to finding a turning point.
When you look at a square, the edge or turn is at 90 degrees, 180 degrees, 270 degrees and 360 degrees.
The square of 9 solves the age old enigma of squaring the circle. When Time and Price ‘meet’, when
Price ties to a particular day/week, the idea is that a timing point is on the table.
Gann stated that every important turning point is a Time/Price square-out.
He did not add that every square-out is not an important turning point.
Not all square-outs are created equal.
Therein is the T Rex in the trading ointment.
As well there are price square-outs and time square-outs, market cycles.
But it is when both time and price are integrated that there is the strongest likelihood for a turning point.
These turning points are in the context of ‘natural’ cycles, astronomical cycles.
I have found the beginning of the minor cycle to be the 360 degree year.
18 months is the next cycle as it is 540 degrees/days…540 degrees comprising a true square or cube
(a 6 sided cube has 6 sides of 90 degrees= 540)
The value in using a physical square of 9 Wheel is that 90% of anything we learn is from what we see.
You have the secret to timing points (natural astrological cycles and market cycles) when you can SEE WHEN they would occur in the future and the ability to see price and time square on the Wheel.
From that step, look for a price pattern which will typically form at and around these ‘vibration points’ to make the greatest amount of money in the shortest period of time.
There are three aspects to trading: hunting a top, hunting a bottom and trading the trend buying breakouts and pullbacks.
Most players advise against looking for tops and bottoms.
But as Paul Tudor Jones says, “I believe the very best money is made at the market turns. Everyone says you get killed trying to pick tops and bottoms and you make all your money by playing the trend in the middle. Well for twelve years I have been missing the meat in the middle but I have made a lot of money at at tops and bottoms.”
Jones believes that technical analysis alone is not enough to forecast turning points because of many false signs.
My method is incorporating market cycles and natural cycles.
This takes us back to where I started this piece, Gann’s Tunnel Thru The Air.
In Gann’s ‘Tunnel’ he refers often to Marie Angel of Mercy.
I believe Marie is Mars.
In many of Gann’s writing’s he refers to cycles within cycles, wheels within wheels, an outer ‘wheel and an inner wheel”.
In markets there are two countervailing forces/cycles working simultaneously— a primary and a secondary trend, like a Double Helix.
I believe he is referring to the rotation of the inner planets and the outer planets.
Many financial astrologers consider Mars to be a trigger.
Think of it like the minute hand on a clock that triggers aspects of the larger planets when the hour hand lines up.
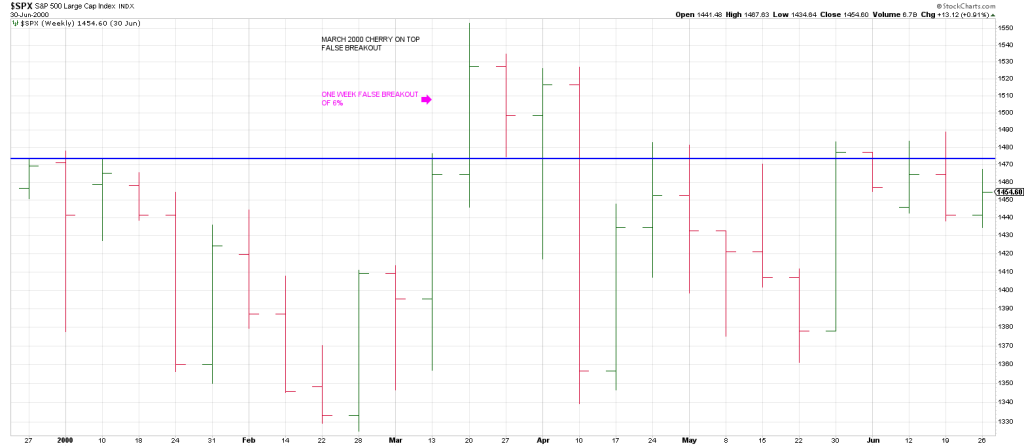
We had such as angle or aspect near the top in March 2000.
There was such an aspect within days of the low in September 2001.
In 2008 the market was in a steep decline. The Mars aspect struck again in March 2009.
In 2020 in late March during the Covid free-fall there were three different Mars aspects pointing to a turn.
Is it any surprise that a major turn took place.
I warn you these aspects do not exist in a vacuum. Trend change indications/ techniques must be used in tandem with this study.
That said, knowing an aspect exist at some point in the future and seeing a pattern set up for a change in trend offers an opportunity to play both sides.
For example in January 2020 the SPX struck a high and dropped to its 50 day line.
It was the first test of the 50 dma in 3 months and the test elicited a rally as would be expected.
The rally made a nominal new high, but shortly thereafter price knifed below the January high.
It then gaped through the 50 day moving average.
The presumption was the market would drop into the aspect in late March 2020.
The Cycle did a good job. It took you by the hand and helped you out.
In late October 2023, the aspect stuck again.
If you used the Monthly Swing Chart as a guide, the 3 Month Chart turned down in October 2023 suggesting a least a bounce. A turn down in the 3 Month Chart is a rare bird.
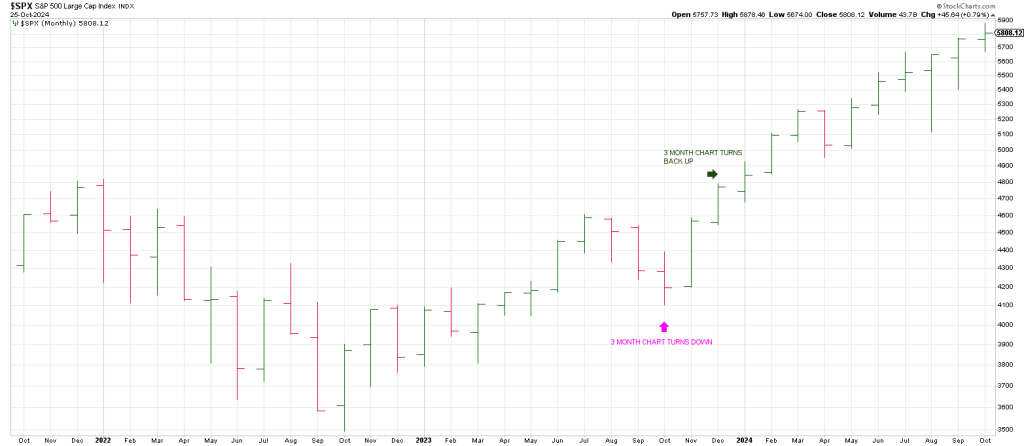
The Weeklies exploded on the last month of October with the dailies gaping above their 20 dma.
The dailies gapped above their 50 day ma the next session.
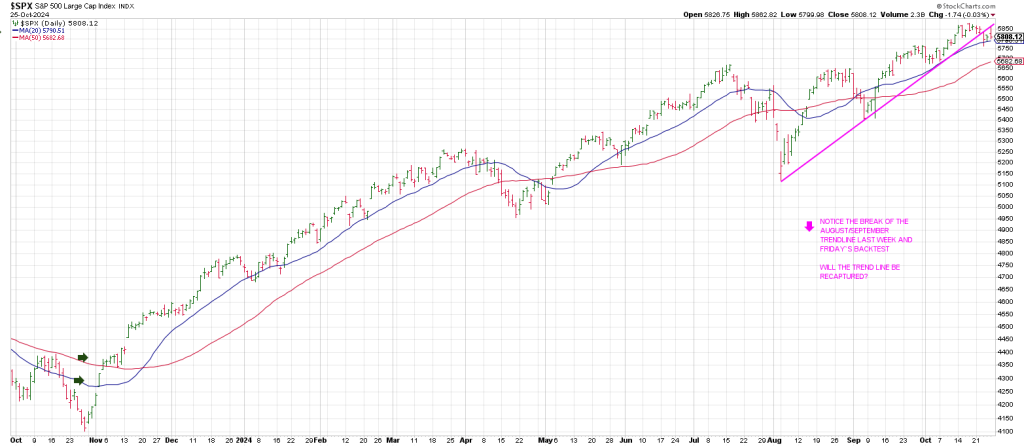
Notice that the Bottoms Line connecting the August/September lows broke last week and was backtested Friday and rolled over.
In October 2002, the aspect showed up again the aspect signaled a change in trend.
In December a variation on the aspect defined a high perpetuating a test of the October low in the following March.
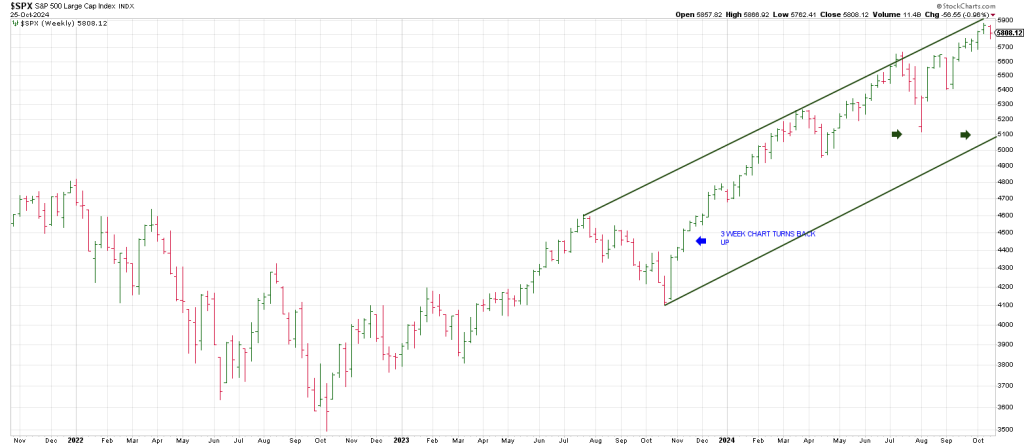
Let’s take a look at 2024. There was an aspect in early April.
The 3 Week Chart turned down and immediately turned back up signaling a meaningful low.
On the week of March 9th, 2003, there was a variation we had this Change In Trend Cycle.
Knowing that this was coming allowed one to fade the rally from the November 2008 low after it peaked in January because The Cycle had not hit yet.
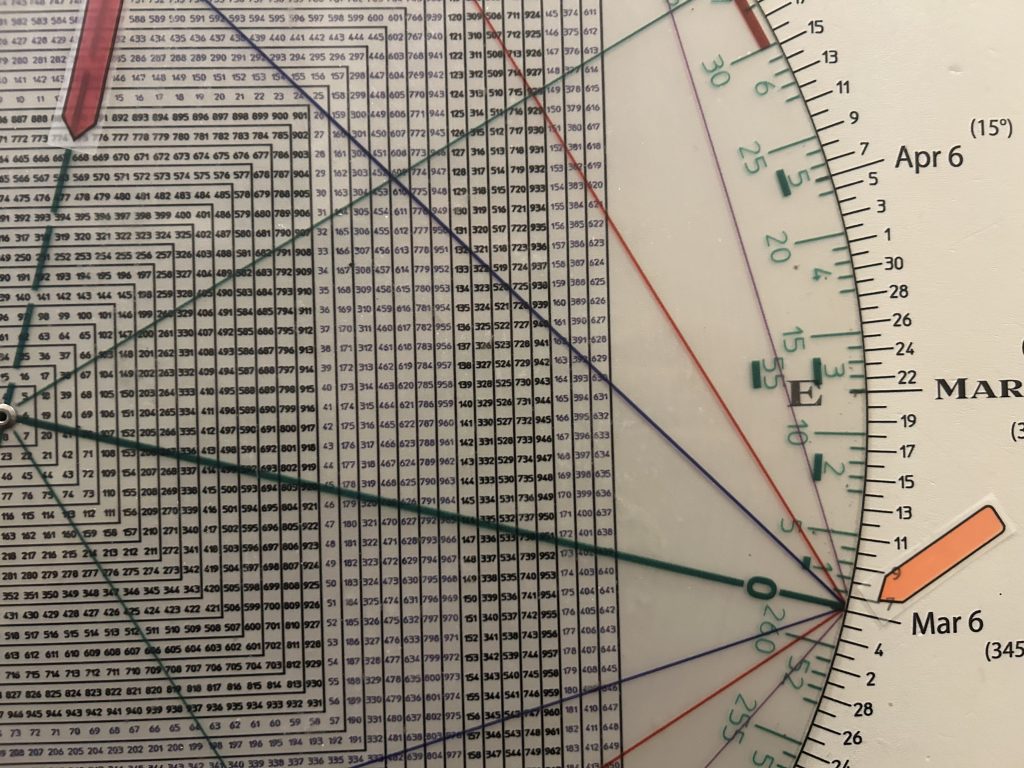
Importantly as you all know by now, on March 6, 2009 there was a Time/Price square-out.
March 6th squares-out with 666/667.
In September 2007, the aspect manifested pointing to a Secondary High on October 11th, 2007.
The next week the SPX knifed back down through the prior high, the July Primary High.
The ‘aspect’ was a great early warning indicator.
In January 2008 the same Cycle showed up again, reinforcing and validating its initial appearance in September.
For the third time this same variation on the Cycle appeared in March early March 2008.
It was a low coincident with a rally phase into Mary 2008.
When the price of the Cycle low from March broke after the May high, the crash was on.
This is one way to use this cycle:
When the cycle low or high is taken out with no new additional occurrence, it may lead to acceleration.
Does this method guarantee a turning point. No. But taking patterns of accumulation and distribution and moving averages into consideration during these aspects offers a powerful glimpse into the future.
In September 1929, there were 4 of these aspects. As you know an historic top occurred on September 2, 1929.
In January 1973, there were 3 aspects within the first 3 months of the year. The presumption was the breakout was false. It was. The market dropped for 2 years.
At the primary low in October 1974, there were two aspects.
At the final low in December 1974 there were three aspects.
Obviously multiple angles/aspects are more significant than a single aspect.
Where are we now is what you want to know.
In July 2024 there were 4 aspects.
The market tanked. It left a Key Reversal Week and turned its 3 Week Chart down.
We got a Flash Crash in early August.
But, as offered above, when the market eclipsed the July cycles it signaled higher.
That said because there were 4 of these ‘cycles’ in July, and based on the fact that it overbalanced in Time and Price any correction since the October 2023 low, it may prove to be a Primary High.
Last week we had two aspects.
What did the SPX do?
It turned its 3 Day Chart down testing the 20 dma and bounced on Friday.
However, that bounce reversed to close on session lows.
Breakage thru the July highs which ties to the SPX 50 day line suggests a major top is in.
Apparently those in ‘the loop’ knew about the Israeli strike on Iran.
But now that hostilities have apparently cooled and the strike was not on oil fields or nuclear facilities, the SPX is spiking as I write Sunday night.
Interestingly, trade above Friday’s high puts the SPX in the daily Minus One/Plus Two sell position.
Let’s look at the DJIA.
The DJIA turned its 3 Day Chart down directly off a record high last week and kept declining.
This is bearish action.
Friday it left a large range outside down day after kissing its overhead 20 day moving average.
It has 3 closes below its 20 day ma.
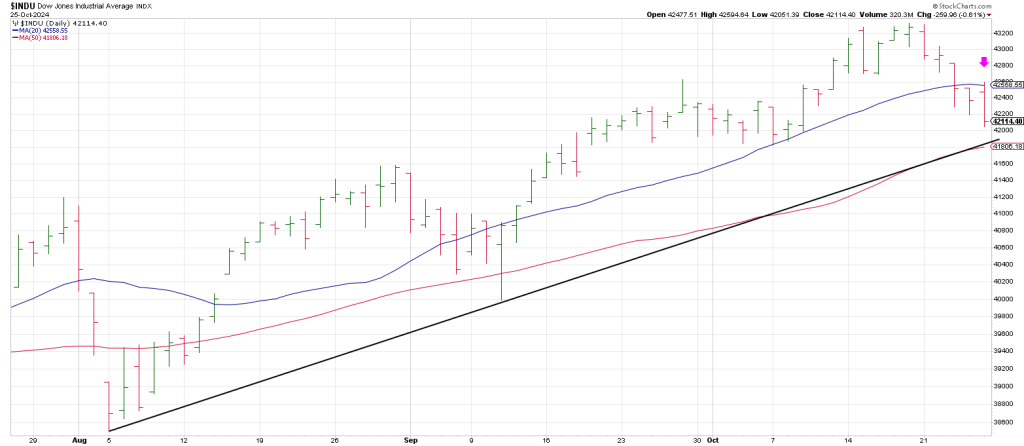
It is flirting with a Bottoms Line connecting the August 5th low and the September 11 low.
This Bottoms Line is coincident with the 50 day moving average.
Importantly this convergence of the rising trend line and the 50 day aligns with the July peaks.
Breakage thru the July peaks signals a major top may be in.
If the rally expected based on overnight futures fades and we turn red in coming hours days with the DJIA failing below its 50 day a blaring sell signal will be sounding in my opinion.
What about the aspect moving forward?
We have an aspect today, on the anniversary of Black Monday in 1929, the second of three great crashes.
We have one other ‘aspect’ this week and nothing else until January 2025 when we get a triple.
In sum, July-October 2002 proved to be a major pattern low.
5 years later in 2007, July-October 2007 proved to be a major pattern high.
Is it possible another July-October pattern high is playing out in 2024 in tandem of a Low to Low to High market cycle…a low in October 2022, a low in October 2023 and a high in October 2024?
Is the high past us?
It looks like we’re at a Point of Recognition in markets.
However, as in March 2000, when the SPX broke out above prior highs NINETY DAYS prior, and ran up 90 points or approximately 6%, the market has been nuts for so long that I would not rule out a 4.4% move on momentum above Friday’s high in a matter of days.
Why?
A monthly SPX shows the decline in 2022 was 1318 points.
A 100% extension of that decline or 2636 points added to the October 2022 low equates to 6127.
As it happens 610 (6100) on the Square of 9 Wheel is precisely 3 revs of 360 degrees up from the
3490 low in 2022.
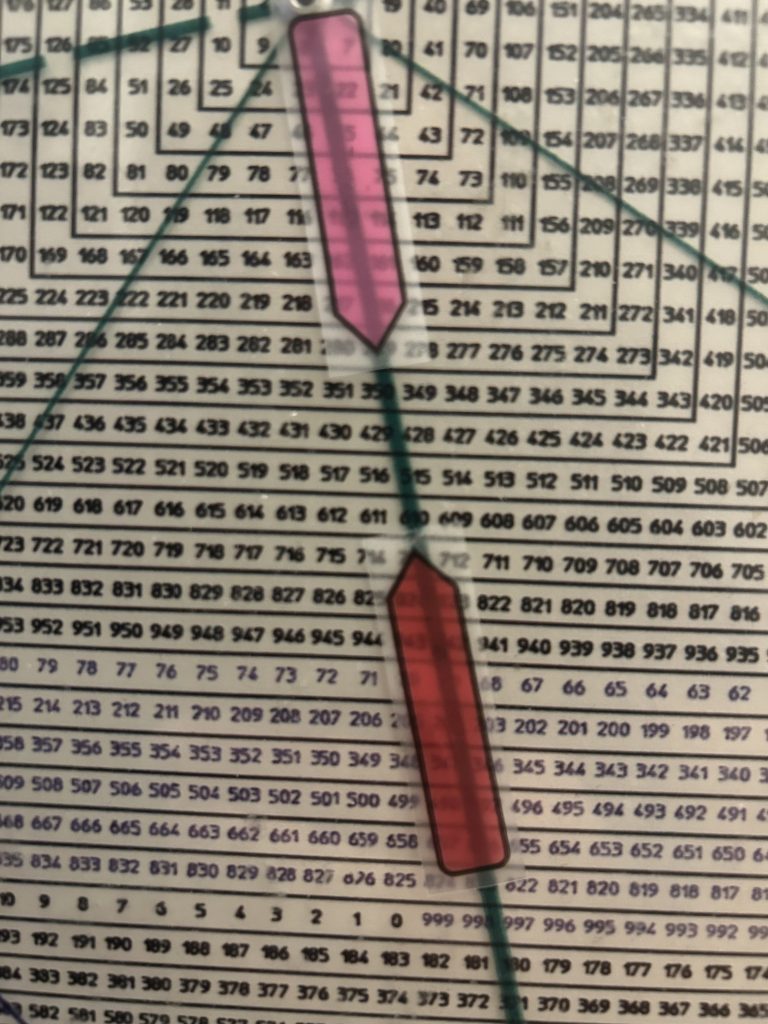
I mentioned this level a few months ago but it seemed preposterous after the August Flash Crash.
But a 4.4% move in a week to put a cherry on top into the election seems like interesting timing for
Irrational ebullience to peak on a mirror image of the free-fall in late October 1929.