“You’ve been locked in here forever
And you just can’t say goodbye.” Apocalypse (Cigarettes After Sex)
“The market rallies to new highs despite 10 year yields surging.
The market rallies to new highs despite metals surging.
Is that bullish?
These moves, with the dollar strong and gold even stronger suggests that markets are beginning to reflect risk in the fiat currency arena relative to gold.”
The above is from Tuesday’s Hit and Run Report, What Lies Beneath.
“The first sign that the weakness that lies beneath the surface reflected by weak breadth is taking hold will be a failure below the 20 day moving average in tandem with breakage below the “circled” 3 Day Chart low. This is the 5762 low from October 23rd.
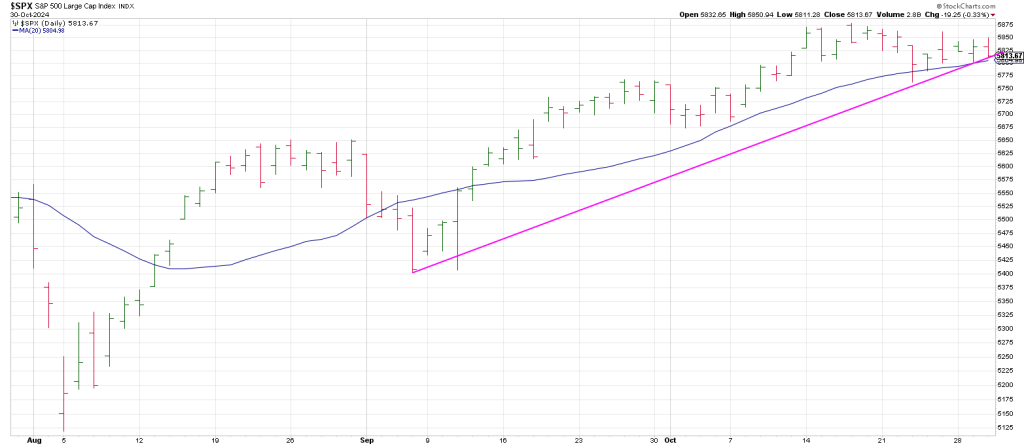
The “circled” 3 Day Chart low is the low where the 3 Day Chart occurred .
That circled low is at 5762.41.
The SPX attempted to rally since the 3 Day Chart turned down on October 23rd, but hasn’t gotten any traction. It’s gone sideways tracing out a 6 day sideways stint at the 20 day moving average.
Bearishly, the SPX eked out a high on Wednesday above Tuesday’s high producing two consecutive daily higher highs while the 3 Day Chart is pointing down.
This put the SPX in my daily Minus One/Plus Two Sell position.
This occurs when the 3 Day Chart is pointing down (-1) and following any time thereafter when you get two consecutive higher daily highs —+2 (NOT NECESSARILY CLOSES).
I count it as conspicuously bearish that the SPX reversed with authority to the downside immediately upon satisfying this -1/+2 sell setup on Wednesday.
From a high of 5851, the SPX skidded to close at 5813 on session lows.
After the close META and MSFT reported, both had an initial knee jerk reaction into the green before the crimson tide took them under.
As such the futes are down 25 points as I write Wednesday night.
We flagged the Test Failure potential double top pattern on the Hit and Run X Feed on Wednesday.
Before reporting on Wednesday, META gapped open to test the October 7th signal reversal bar.
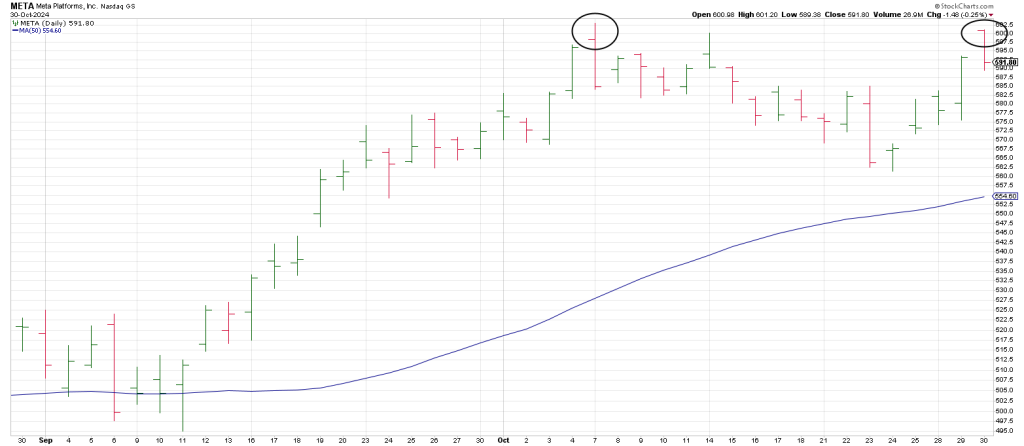
As W D Gann stated, Secondary Highs are the safest place to short.
META traded down to 573 after hours.
For its part MSFT shed another 15 points after hours taking it back below its 50 day line.
What META and MSFT had in common Wednesday besides their red reaction to earnings is that even before reporting, both left signal reversal bars. Both gapped up marking the high of the day and reversed to close near session lows.
It’s not surprising given a report I saw after the bell.
The report states that institutional traders just sold the most amount of stocks last week in more than 9 years.
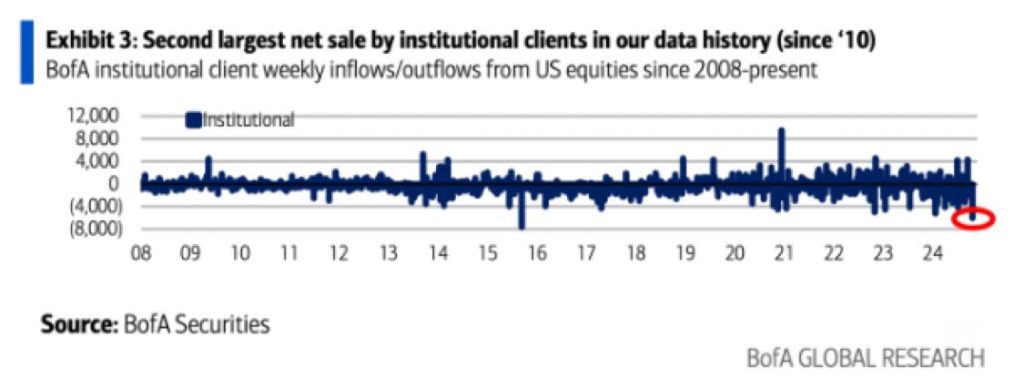
This explains the price action in META and MSFT after reporting…when green turns to red.
In the historic 95th anniversary of October 1929 the oozing underneath the surface in 2024 started in earnest on October 23rd, one day off October 24th when the air whooshed out of the bubble in 1929.
Interestingly, the DJIA 386 price high in 1929 squares out with October 17/18th—the intraday and closing all-time SPX highs so far in 2024.
On October 17th, 2024, the SPX gapped up to an all time high of 5876 (587) but reversed to close on its low of the day at 5841 (584).
The pattern is in the spirit of a Soup Nazi sell.
Why?
Because the index scored a new 20 day high (in this case an all-time high but reversed below the prior high within the 20 day look-back.
I say ‘in the spirit of’ because the strategy typically requires a 4 day interval between the reversal day and the prior high within that 20 day look-back—the reason for this is to guard against continuation moves.
In the case of the Oct 17th reversal there was only a 3 day separation.
That said the market is not a Rolex.
Moreover, October 17th and the 584-587 region squares-out with October 17th, the day of the high.
Potentially significant is that 584-587 and Oct 17 also square-out with 67, the SPY low on March 6th, 2009, where this 15 year advance started.
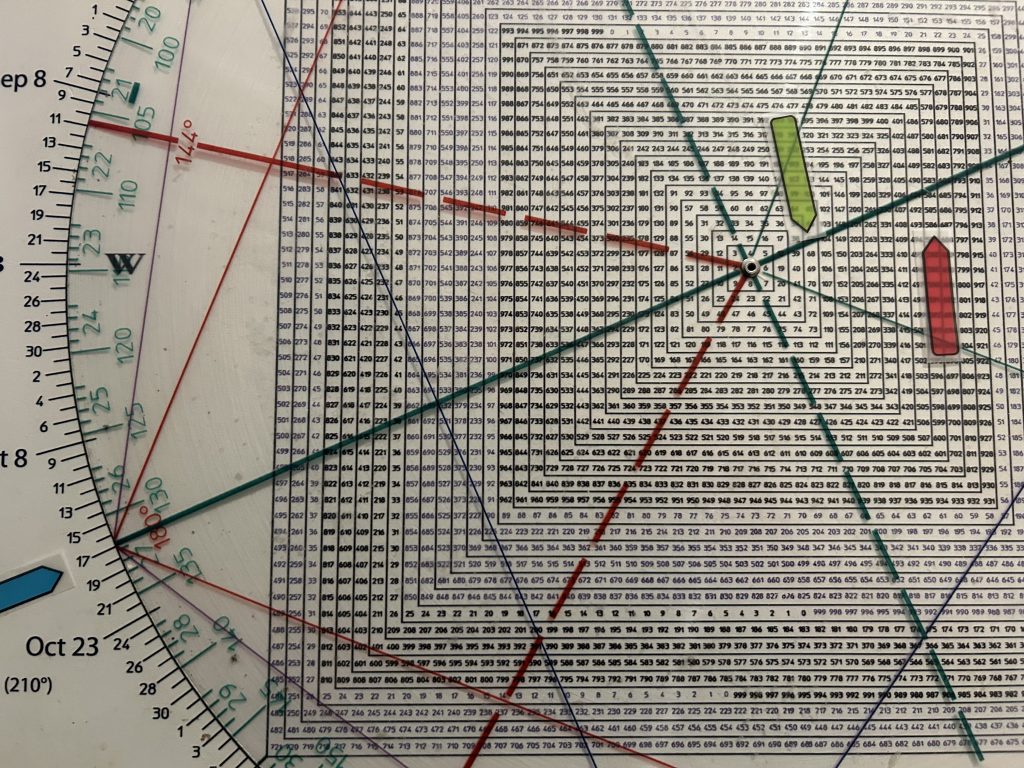
67 (green) is on the same axis as 584.
Said another way the bear market low, 67, vectors 584.
As well both 67 and 584 are 180 degrees opposition October 17th.
In other words the price of the major low in 2007 is opposite the date of October 17th.
And, the 584-587 region is an harmonic of Oct 17th and 67.
Is it possible October 17th was a major high?
In a word, yes.
But door remains open for the potential of a Spike & Reversal to a new high that fails on the election.
Not because of the results one way or the other, but because the Algomatics use any excuse they can to game the tape. Just like do on Fed Days with what I call FOMC Cha Cha.
As offered on the Hit and Run Private Twitter/X Feed this week our expectation has been for extreme volatility over the next week.
Hit and Run members bought QQQ puts yesterday because 580 (5800) squares-out with today.
That means if 5800 fails to act as support, the market should accelerate lower.
We stated on the private twitter feed that breakage below 5800-5790 opens the door to the low 5700’s
Since Thursday is Day 7 of the line formation at the 20 day moving average, we could get a panic.
Gann wrote “7 is the number of time and panic”.
All I read about is that if Trump wins the market is going to rip for 4 weeks or 4 months or 4 years.
There is a universality of opinion that the market is poised to echo the ramp following the 2016 election.
However, our expectation, given the cycles and the structure of the market since not only the 2009 low but since the 1982 low and the 1932 low has been that we may get a mirror image foldback on a Trump win.
In 2016 the market plunged overnight and then reversed starting a 15 month Runaway Rally.
During the entire move, the SPX never took out the low of a prior month!
A mirror image this election may see a false spike that would mirror the false spike in March 2000 and 1973.
From my perch, sentiment, cycles, and the structure of the market suggest a 15 month or so decline from this time frame is not the short straw that
In sum, in every bubble like 1929, 1987, 2000 and 2007, the last stages are marked by institutions dumping stock on retail who have become disabused of the Biblical truth that there is a time to buy and a time to sell…a time to reap and a time to sow.
The public has become convinced that cycles don’t exist and that the only way to capture growth is by holding through thick and thin— they have capitulated to the idea that the market cannot be timed. They have become convinced that the geometry of the market is voodoo.
But the mind of the market is math.
As W.D. Gann stated, “The limit of future predictions based on exact mathematical law is only restricted by lack of knowledge of correct data on past history to work from.”
As well, W.D. Gann like to quote Faraday, “There is nothing in the Universe but mathematical points of force.”
History is going to be made over the next year.
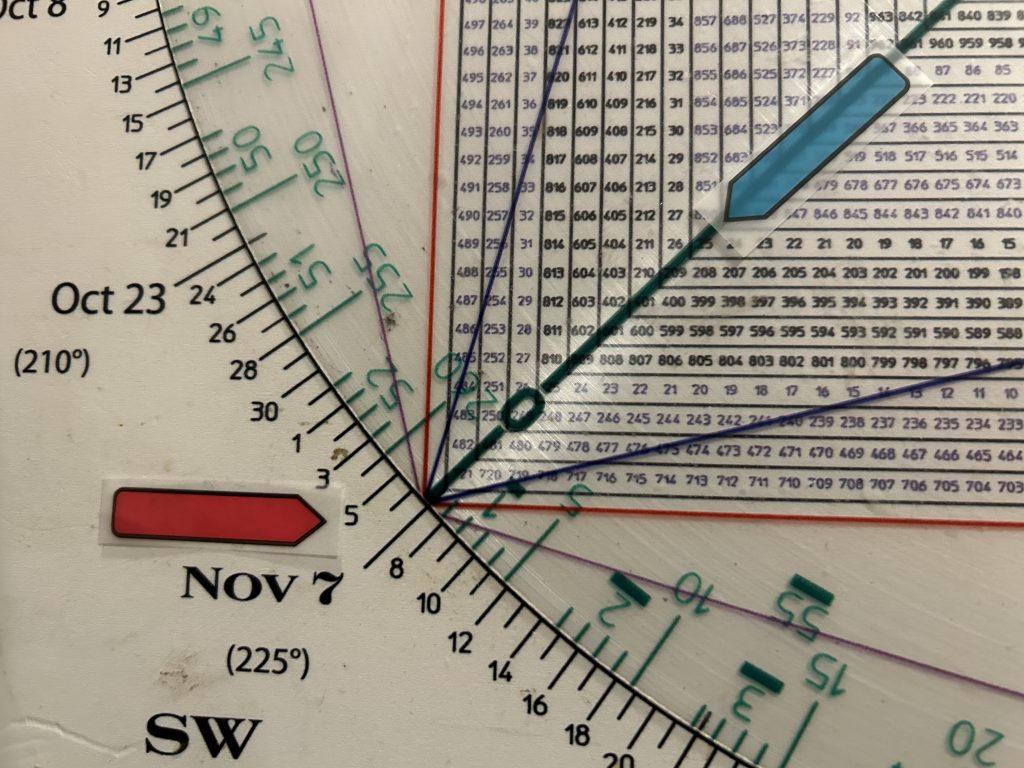
On my Square of 9 Calculator 2025 (blue) “points to” November 7th and the week of the election.