“All the things I thought I figured out I have to learn again” The Heart of the Matter, Don Henley
“Just tell me the bad news; the good news will take care of itself.” Warren Buffett
The ancients believed that Eclipses foretold the future.
Generally, Solar Eclipses are considered more powerful and longer lasting than Lunar Eclipses.
Lunar Eclipses tend to have short term effect on the financial markets—often increasing volatility around the date of the Eclipse.
Solar Eclipses are deemed as important messengers of longer term changes in the financial markets and geopolitical landscape.
The reason I am writing about this now is because I have discovered that Total Solar Eclipses are the most powerful of the four different eclipses.
In other words, if you want to measure forwards and backwards 90, 180 and 360 degrees from all eclipses you’re going to get too many potential turning points; however, if you use only the Total Solar Eclipse a Cyclical Kimono opens.
The next Total Solar Eclipse will occur on August 12, 2026. Therefore, the prior Total Solar Eclipse on April 8,2024 will still be valid —will still exert its influence—for the year 2025.
Notice that April 8, 2024 ties to the first pullback from the advance that started in October 2023.
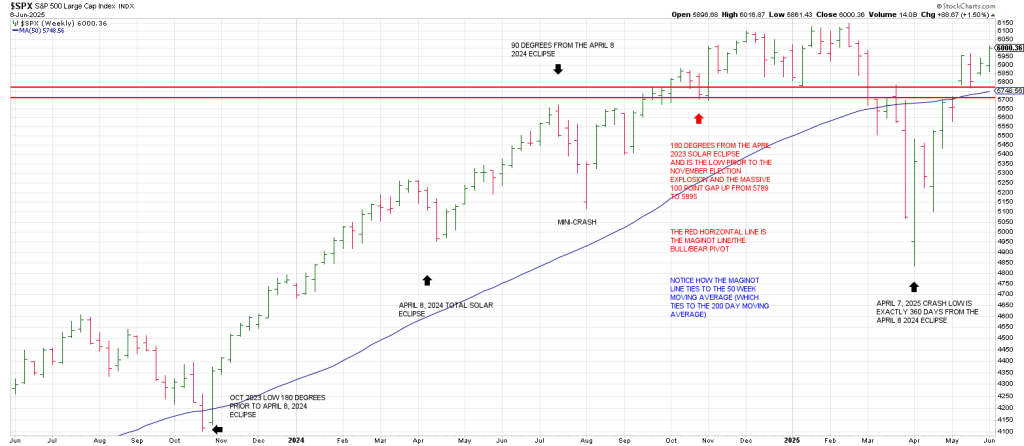
The important thing to notice is that October 2023 is 180 degrees/days prior to the April 2024 Total Solar Eclipse.
It looks like we have a good place to measure from.
Remember we are referring to TOTAL Solar Eclipses, not Partial Solar Eclipses.
There are two of those in 2025.
90 degrees/days from the April 2024 Total Solar Eclipse is July 2024. It nailed a top prior to a mini-crash that we capitalized on.
Hit # 3.
360 degrees from the April 2024 Total Solar Eclipse is April 2025.
This was the low of crash. The low played out 7 weeks from the February top in keeping with the Gann Panic Window.
Direct Hit #4.
On the 7th week the SPX left a massive upside reversal installing large range Train Tracks
180 degrees/days from the April 2024 Total Solar Eclipse is Oct 2024.
This marked the low prior to the election explosion and 3 Drives to a High in Feb 2025.
9 months or 270 degrees from the April 2024 Total Solar Eclipse is January 2025.
Jan 2025 is the first time the SPX had a weekly close above 6100.
It never exceeded that weekly closing high other than marginally 3 weeks later and it never stuck.
Notably the close prior to the election explosion is roughly 5780
This ties to the 160 point Breakaway Gap in early May above 5720 to the 5845 region in early May 2025.
The Swiss Miss Deal No Deal.
This 5700 to 5800 region is an important Bull/Bear Pivot.
Underpinning the significance of this 5780 region is that the pullback into May 23rd bottomed at, yep, 5770.
The April 2025 low is roughly 900 SPX points below the 5700 mid-point of what I’m calling the Bull/Bear Pivot…the Maginot Line.
900 points above 5700 equates to 6600
Does the SPX have a date with the 6600 region if a melt up occurs above the prior 6147 all-time high?
Interestingly 6600 is basically a fractal of the 666 bear market low in 2009.
It represents a 10 fold increase.
To put this in perspective the DJIA advanced 6 fold from its 1921 low of 64 to its 1929 top of 386.
From the 666 bear market low in 2009 the SPX advanced just over 9 fold to Feb 2025.
The February 2025 top may have satisfied a major top.
But if we exceed it, the 6600 region is on the radar.
What is interesting is that 3 X the 666 low is 2000.
The SPX reached the 2000 level in August 2014 and essentially went sideways for two years.
Following an A B C corrective move into Feb 2016, the SPX broke out.
This 3-6-9 extrapolation is reminds me of Nicola Tesla’s statement: “If you only knew the magnificence of the 3, 6 and 9, then you would have the key to the universe.”
Let’s walk backwards from the August 12, 2026 Total Solar Eclipse.
360 degrees prior to the August 12, 2026 Total Solar Eclipse is August 12, 2025.
That should be a turning point week.
540 degrees prior to August 12, 2026, was February 12, 2025.
540 degrees is a cube, a TRUE SQUARE.
An all time high occurred one week later.
In other words the February 2025 all-time high cubes out with the Total Solar Eclipse in August 2026.
Amazing.
The SPX has not traded above that Feb high for 4 months.
As you can see, time runs forwards and backwards as to these Eclipse vibrations exerting their influence.
November 2025 is the mid-point between the Feb 2025 high and the August 2026 Total Solar Eclipse.
My expectation is that November 2025 is going to be extremely significant.
If November 2025 is a mid-point then 9 months prior to it was February 2025 and a top of some degree and 9 months after is August 2026, the Solar Eclipse.
Interestingly, November 2025 is 17 years from the November 21, 2008 Great Financial Crash low.
That was the low of the NAZ and the low around the world.
The March 2009 is an Undercut Low.
The correct place to measure from is the November 2008 low.
We’ve discussed the 17 Year Cycle before.
From the historic 1932 low + 17 years is 1949, the start of a secular bull market.
17 years later is 1966, the start of a secular bear market.
17 years from 1966 is 1983, which ties to the start of the secular bull market that started in August 1982.
17 years from 1983 is 2000, the start of a lost decade.
17 years from 2000 is 2017, a vertical move that topped in Jan 2018, with Volumgeddon
On the Square of 9 Wheel, 17 is straight across and opposite November.
As well the ‘year’ 2025 aligns with 17 and November.
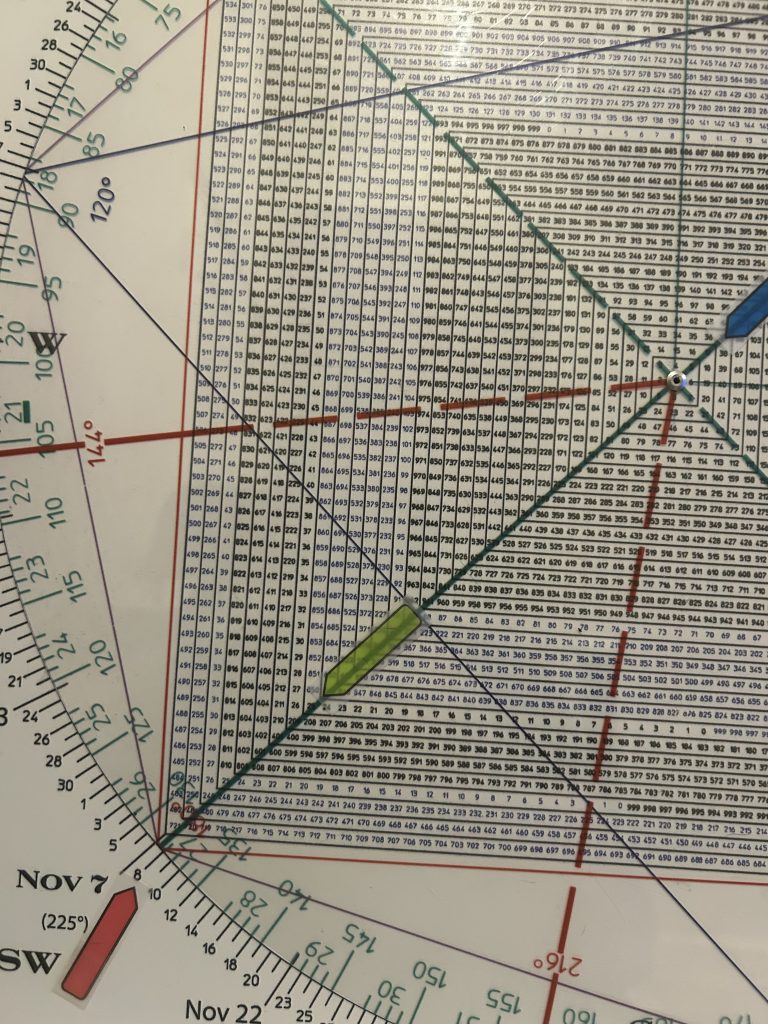
17, blue
November, red
2025, green
For the past month the market has shrugged off every excuse that could have perpetuated a downdraft.
But it may be borrowing against the future.
A correction when it comes could be an air-pocket.
Tomorrow’s report will discuss the big picture cycles that point to a sell off.
It is the nature of such a decline that will tell us whether a leg up to 6600 ish is in the cards or, alternatively,
Whether a vicious C Wave decline below the April low is on the table.
Why has the market held up seemingly against all odds?
I think one answer is the Trump’s Tariffs have caused consumers and companies alike to buy buy buy ahead of tariff’s. They may have paused but may be re-implemented.
This pulling forward of demand makes companies bottom lines shine currently, but by the fall, shrinkage in the bottom line could dull risk-on sentiment.
In sum, the second half of the year shapes up like a last chance to sell.
On Friday, June 6, the SPX aligned/squared out with the 2009 low of 666.
The SPX has backtested the low of the high bar week from mid-Feb.
Consequently given short term cycles and this month’s ‘natural’ cycles of Gann’s Chronocators, Jupiter and Saturn square in mid-June. it would not be surprising to see a pullback since the market has run hard into this point.
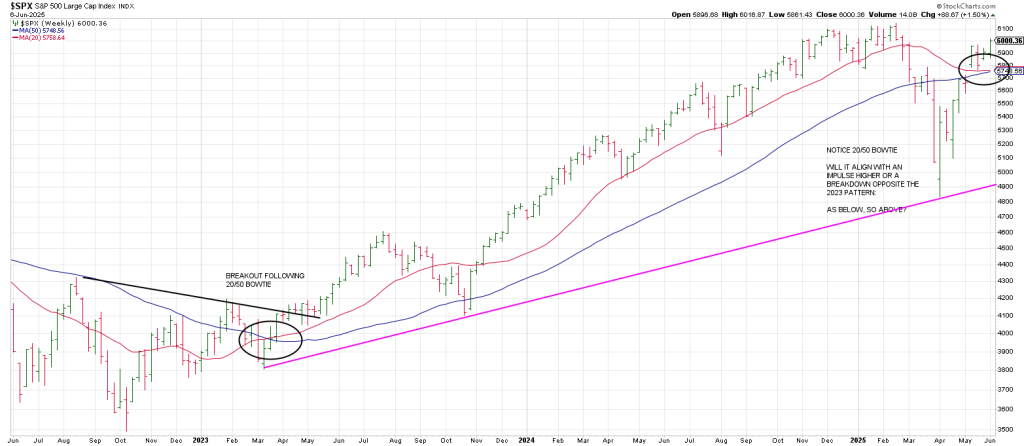
A 200 point SPX correction simply takes it back to the region of the big Phil D Gap from May 12 where there happens to be a weekly 20/50 moving average Bowtie.
Incidentally, the last time the SPX had a weekly 20/50 Bowtie was in March 2023. The was the breakout following the October 2022 low.
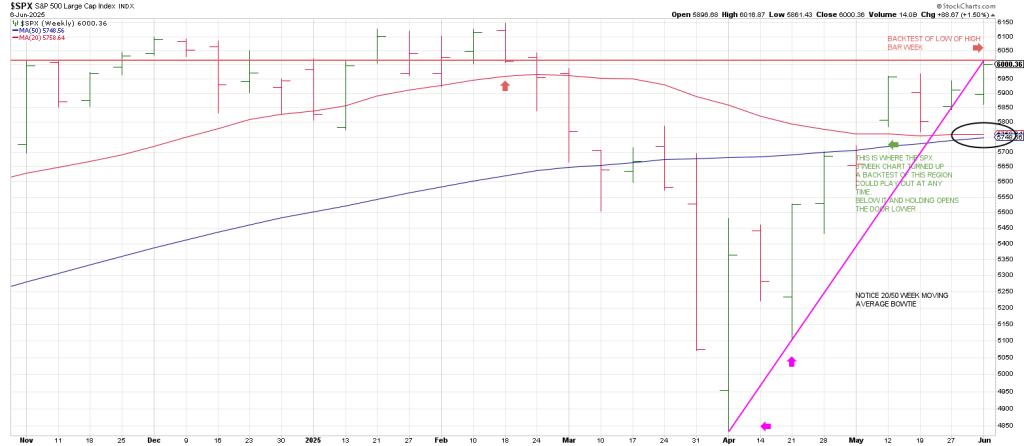
Notice where the 3 Week Chart turned up at 5700 in early May.
If a correction plays out it would not be surprising to see it magnetized to backtest that region.
Tomorrow’s report will discuss how the above market and natural cycles tie to Gann’s Master Cycle.
The Roadmap for Monday:
A sharp selloff into 10:00 followed by an equally sharp rally into 10:15 where another pullback for a higher low supports another rally into 11:45.
However, there is a possible Inversion Pivot at 10:30 where a continuation of the rally is indicated but may get derailed.
Either way, a pivot high is projected for 11:45 followed by a decline into 1:30.
From there a stair step rally is suggested into 3:00 and a slight pullback into the close.