“It’s worth noting that the assumption that something can’t happen has the potential to make it happen, since people who believe it can’t happen will engage in risky behavior, an thus alter the environment.” Howard Marks
“You’ve been locked in here forever and you just can’t say goodbye.” Apocalypse, Cigarettes After Sex
Wednesday the DJIA struck a record high of 48,254.
It mirrors the 3 Day Spike Rule that put in an all-time high on the SPX on October 29.
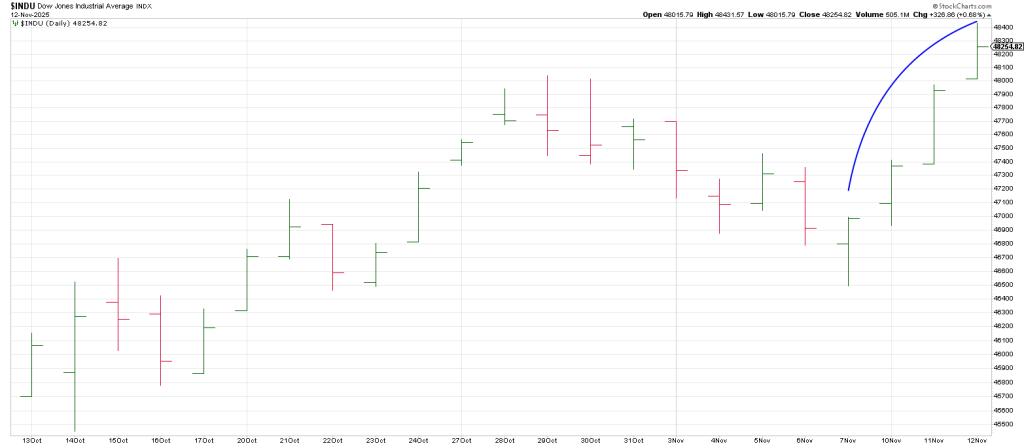
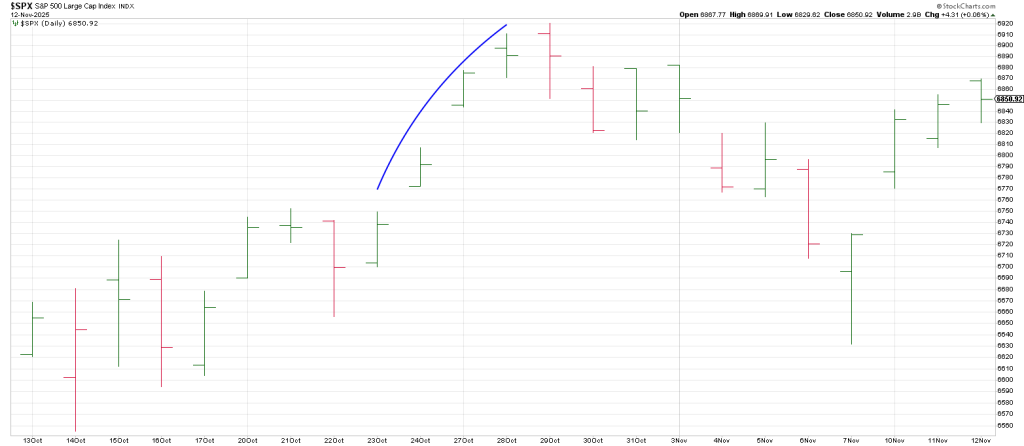
Maybe something, maybe nothing but the DJIA high boils down to 483.
This mirrors the SPX low on April 7, 2025 at 483 (4835).
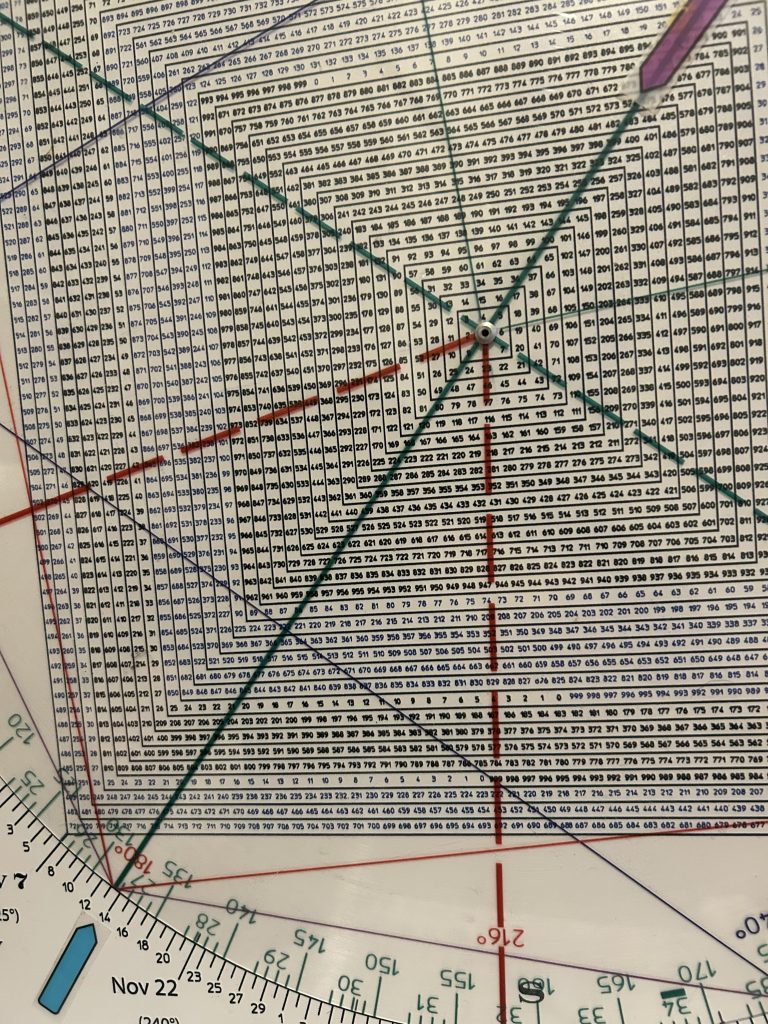
What’s interesting is that 483 is straight across and opposite today, November 13.
Further, November 13 was the crash low in 1929.
IF a mirror image fold-back is playing out this synergy supports the thesis.
In sum the SPX low price in April squares out with today.
The DJIA high for the year (so far) squares out with today.
Underscoring these time/price relationships is a monthly DJIA from 1929 to today.
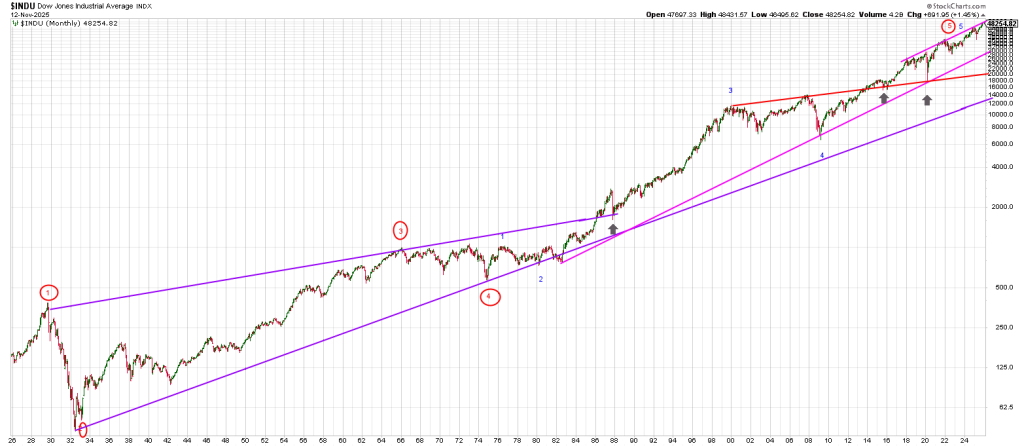
In particular, notice the magenta channel.
I connected the 1982 low with the2009 low. The 2020 low nailed this trend line.
The geometry is compelling.
Currently that trend line ties to around 30,000.
Notice that a Tops Line taken from the 2019/2020 highs hits the 2022 peak, the Feb 2025 peak and is
Once again being tested here in November.
Breakage below the bottom of the magenta channel triggers a big picture Rule of 4 Sell opening the door to the red Ghost Line which comes in at around 20,000.
Breakage below the red Ghost Line opens the door to the purple trend line from 1932 which currently resides around 13,000..
Is it possible the DJIA drops to 13,000 going into the 100 year cycle in 2032 which is a Gann SEVEN panic years from 2025?
The Wave structure from 1929 suggests a major top is on the table.
1929 was a Wave 1 Super Cycle top.
1932 was a Super Cycle Wave 2 low
The current wave dates from DECEMBER 1974.
51 years ago.
Notice that the 1987 crash was ‘caught’ by a trend line from the 1929 high and the 1966 high.
Black Monday looks like a pimple on the chart.
Similarly the Covid Crash found support at a Ghost Line connecting the 2000 top and the 2007 top.
Not everything in markets are predetermined. But the big things are.
Ignore these big picture trend lines at your own peril.
“We conclude that most of the time, the future will look a lot like the past, with both up cycles and down cycles. There is a right time to argue that things will be better, and that’s when the market is on its backside and everyone is selling things at giveaway prices. It’s dangerous when the market’s at record levels to reach for a positive rationalization that has never held true in the past.”
— Howard Marks