“I have watched you on the shore
Standing by the ocean’s roar.” Little Surfer Girl, The Beach Boys
W.D. Gann used Time/Price harmonics to forecast major market events.
What does that mean?
In its simplest sense, it means there is a relationship or vibration between the date of a high or a low and the price of a high or a low.
“When time and price square-out expect a change in trend.” W.D. Gann
Most people think the Roaring Twenties encompassed more or less the entire decade of the 1920’s.
Actually the Real Roaring Twenties began from a breakout on the week of October 24th, 1924 when the DJIA broke out of a Triple Top (A Rule of 4 Buy signal) and broke out of a Cup and Handle (green).
Remarkably, October 24th is the day the air came out of the Roaring Twenties Bull Run.
It is also the week of the 1987 Crash.
Let’s go back to the top of this article. How do Time and Price harmonics fit in?
As to 1929, the DJIA price high was 386.
386 squares out with October 19 and the week of October 24.
That also marks the anniversary week of the waterfall declines in 1929 and 1987.
W.D. Gann used anniversary dates to pinpoint major market moves When Time and Price harmonics lined up the odds were a major turn was brewing.
A daily DJIA from 1924 thru 1929 shows the 5 year or 60 month bull run.
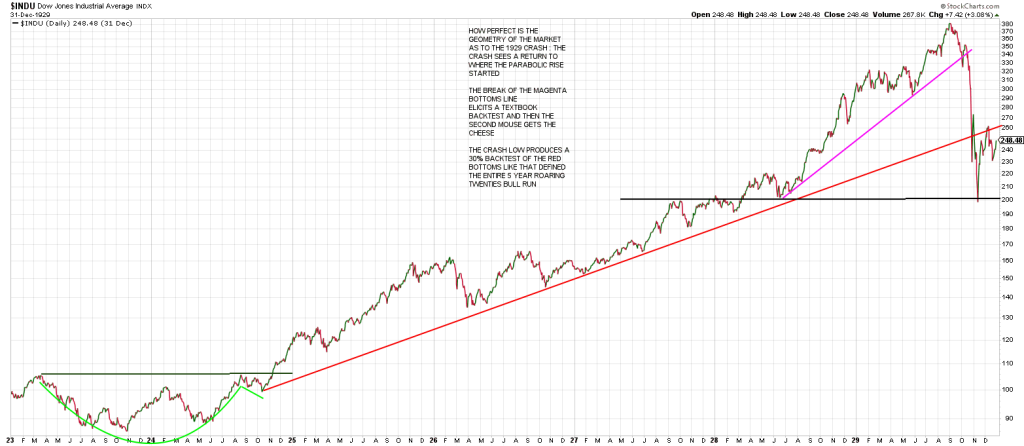
Notice how perfectly geometrical the market is.
The crash in 1929 revisited the region where the last run for the roses started in the 200 region.
Amazing.
Notice when the red rising trend line from 1925 broke the marked plunged to the region where the parabolic run started.
It would not surprise me in the least to see a return to where this advance started in October 2023 at 4100.
Quickly.
Indeed not only would I not be surprised. I expect it.
Pay me now or pay me later.
That crash low in November 1929 perpetuated an immediate 30% rally and ultimately a 5 month counter-trend rally into April 1920.
Of course at the time the world thought it was a “return to normal”
I suspect after the crashes in 2018 that ‘came back’, the Covid Crash that produced a quick 100% advance, and the recent Flash Crash this August, that when this bull breaks in earnest that the first big counter-trend rally will be viewed as a ‘return to normal” as well.
There is not nor has there been anything normal about the bull market for years…and certainly not this time period.
I’ll address that in tomorrow’s report.
And I’ve got company: Warren Buffet has been selling stock hand over fist.
But what does he know.
Exactly WHAT does he know?
Using a simple Bottoms Line (rising trend line) from the start of the last runup in 1929 did a good job of sounding a blaring alarm.
The magenta Bottoms Line was snapped at the end of September eliciting a 1 week knee-jerk rally that backtested the broken trend line.
The SECOND MOUSE GOT THE CHEESE. Bigly.
How does that apply to our market today?
We’ve been saying since last spring that this year will define a major high.
That there is a lot of synchronicity cyclically with 1929 this year.
Let’s put the pieces together.
The last leg up to the 1929 top was just over a year from late July 1928.
The current advance in the SPX is just over a year old from late October 2023.
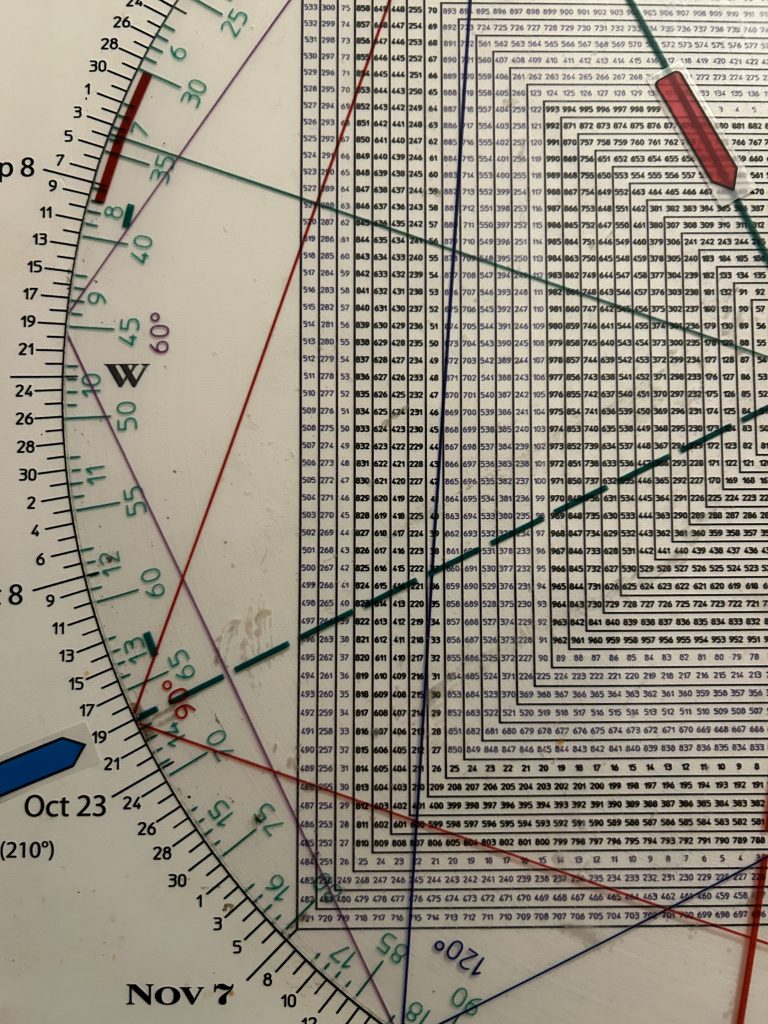
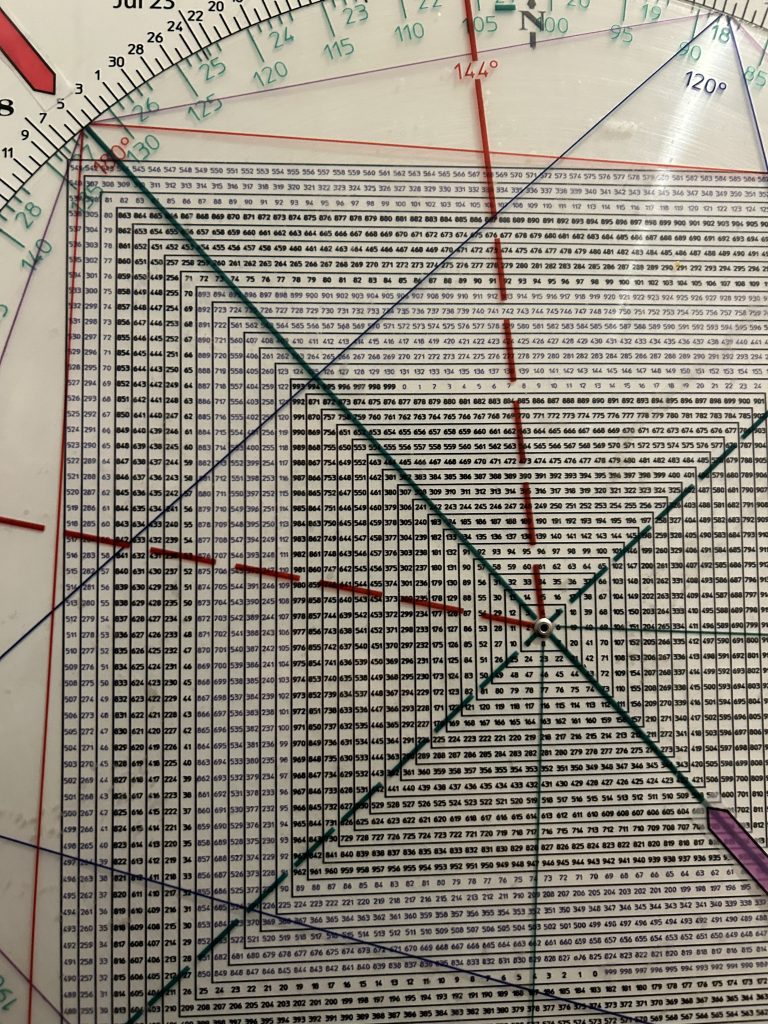
Using the number grid on the Square of 9 as years versus price shows that 1924, the year, squares out with September 1st, the week of the high in 1929.
This is a typical relationship with a low in time pointing to a high in price.
As well often, a high price will square the high day or the low price will square the low day.
As it happens the year 2025 points to this week, Nov 7 specifically.
2024 points to November 9th.
Nov 5th is obviously Election Day and November 6th we get the Fed.
Synergy is pointing to this early November period like Donald Sutherland in Invasion of The Body Snatchers.

With this Line-Up synchronous with the year 2025, the forecast for 2025 will be critical.
This week will connect the dots on that forecast.
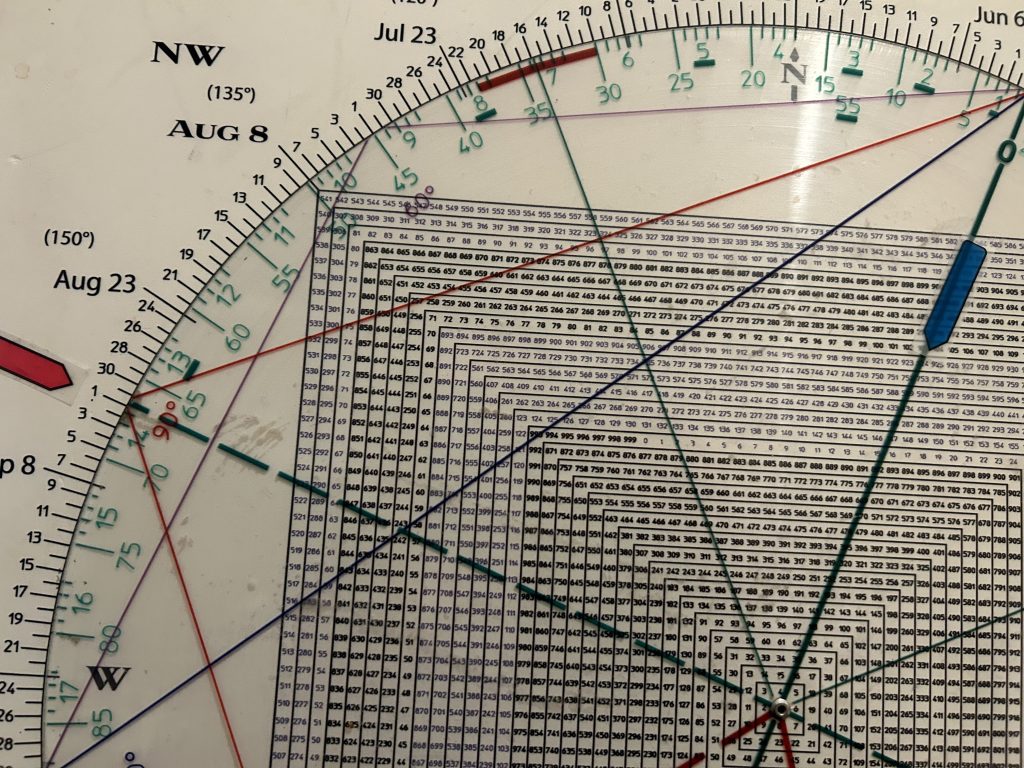
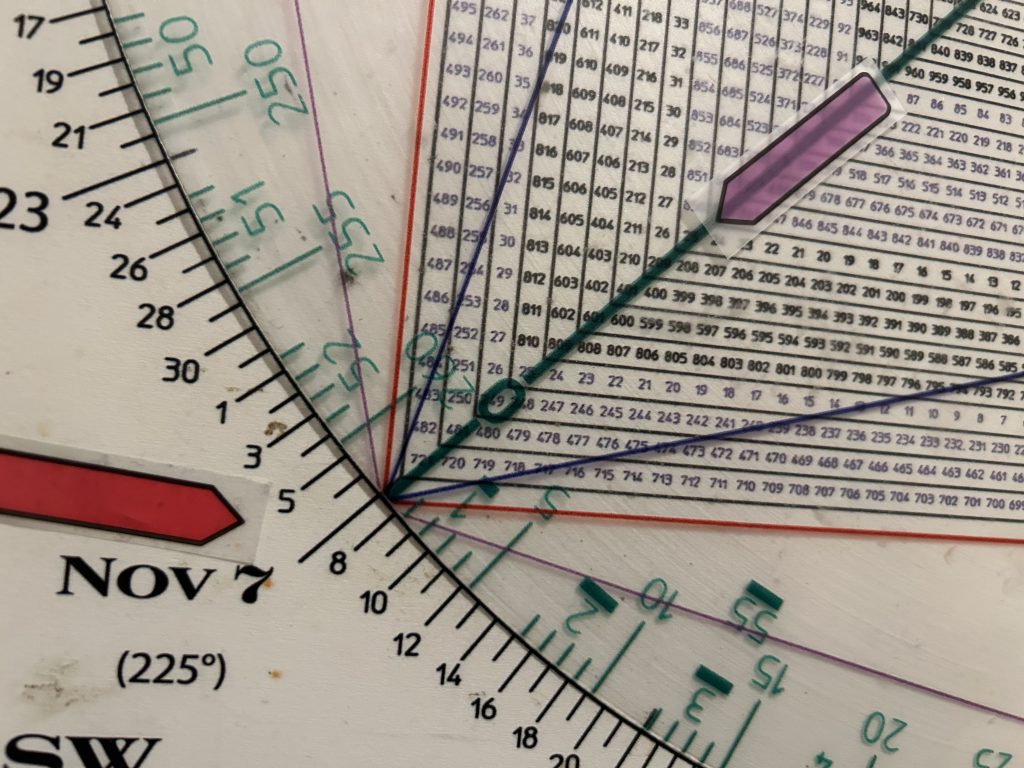
In sum, we have a confluence this week (specifically Tuesday/Wednesday) because November 4th/ 5th is 90 days/degrees from August 5th, a Flash Crash and the last major swing low (508 pre-market on the SPY).
Hit and Run members were loaded with puts for that swan dive and we covered them on the open.
Why?
The SPY was trading at 508 pre-market and 508 is 180 degrees opposite August 5th for a Time/Price square-out.
Underpinning the power of the Square of 9 is that August 5th wasn’t just a low, It was a spike low that produced a near 900 point SPX rally in 3 months.
In addition 579/580 squares-out with October 31.
That is why I tweeted on the Hit and Run Private Twitter/X Feed last Tuesday that breakage below 579/580 on Thursday, Oct 31) would likely see a dive to 570 that same day.
Consequently Hit and Run members bought SPY puts and added to QQQ puts on Wednesday as the SPY tailed off. It did so after satisfying a Minus One/Plus Two sell setup (the 3 Day Chart pointing down followed by 2 consecutive higher daily highs).
What happened?
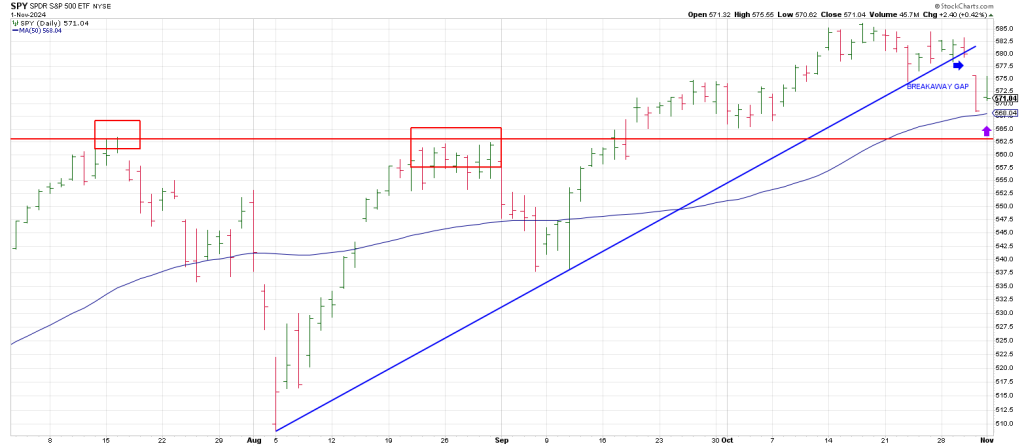
We got a Breakaway Gap below the 20 day moving average on Thursday opening the door to lower prices. The SY because a heat seeking missile to 570 and its 50 day moving average.
Friday we tweeted that 5724 is the downside pivot as it is 180 degrees down from the 5877 ATH>
The SPY drove back above 5724 on Friday but tailed off to close only a tad above it at 5728.
This is after spiking to as high as 5722 intraday.
The takeaway is that breakage back below the 5724 pivot that sticks with follow thru this week below the 50 day line at 5701 (near Thursday’s low) opens the door to:
a) 5664 (270 degrees down fro high)
b) 5589 (360 degrees down from high)
That inability to maintain traction Friday diminishes the odds for an idealized spike to 6100 ish where a Measured Move is satisfied. Something we covered last month and will revisit tomorrow.
Suffice to say there is a potential major square-out with the October 2022 low at the 6100 region.
Notably, Thursday’s Breakaway Gap snapped a Bottoms Line connecting the August low and the September low.
If Phil D Gap (and the broken Bottoms Line) is recaptured theoretically it opens the door to the aforesaid 6100 ish print.
Quickly.
What should follow if 6100 + is struck will surprise the vast majority of traders.
Tomorrow’s report will fully flush out what The Cycle is calling for.
Alternatively, downside follow thru below the summer peaks of 5650-70 indicates a major top is behind us.
Notice that 5664 ties is 270 degrees down and ties to the Maginot Line—the summer Twin Peaks.
If the Twin Peaks go it may get so surreal in coming weeks/months that they have to call in David Lynch to be Fed Head.