Technician extraordinaire Robert Farrell of Merrill Lynch many years ago stated, “Excesses in one direction will lead to an opposite excess in the other direction.”
That’s a natural progression. Markets breathe. At times as during this April, they hyperventilate.
Except for one thing, I don’t think there was anything ‘natural’ about Wednesday’s miraculous rebound.
Remember the spike the other day on a rumor of pause in the tariffs?
And the reversal when the White House DENIED it? Pshaw.
Somebody jumped the gun. Maybe it was a ‘smoke signal’ to offer “plausible deniability” about inside information.
But then that’s how traps work…
They get set, they get sprung.
They just don’t happen out of the blue.
I can’t help but wonder if Bessent walked into the Oval Office after Black Friday/Monday and showed Trump how we were mirroring the pattern of 1929.
Bessent to Trump: “You wanna piece of this?”
The trouble is one of credibility.
That’s why gold has not been taking gas and dropping in tandem with the market.
That’s why gold has ramped despite higher interest rates.
Long time readers will remember me saying that gold rallies out of distrust and disarray in government.
So as the President backed away from his pledge to keep tariffs on all foreign nations in place indefinitely—retreating under pressure from the faltering bond market—equity markets roared back with a vengeance.
The rebound produced one the most significant one day gains in history.
Such bounces are familiar terrain for experienced bear market traders who know that the largest rallies occur in bear markets.
Historically, bear markets are defined by their extreme volatility—sharp drops, dramatic rallies and even steeper declines that follow when the vast majority of shorts get squeezed out leaving little buying power to come from subsequent potential short covering.
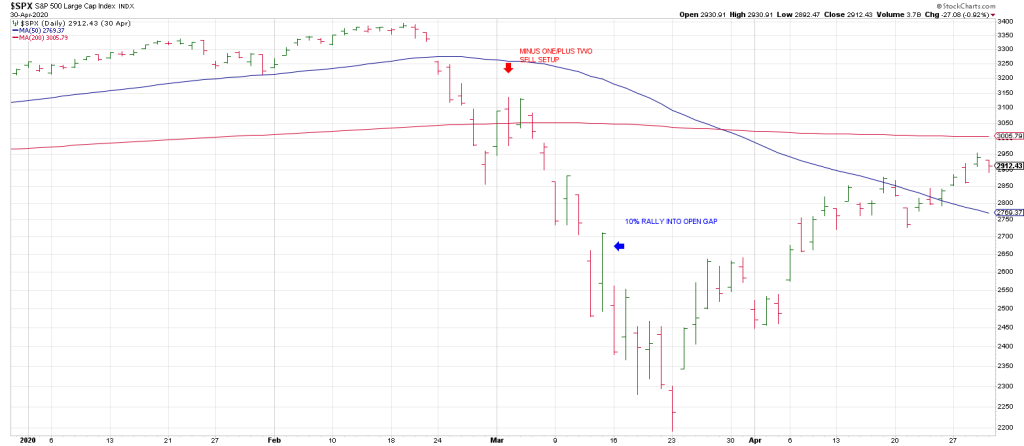
To illustrate, the chart below highlights the SPX behavior in February and March of 2020 during that bear leg.
But this was one for the books This entire month has been like being tied to a chair and watching a toddler play with a loaded pistol.
Yesterday the pistol when off. There are 5 more bullets.
It’s as if the Algomatics were given their marching orders: “Once we pause, you don’t: you keep pressing the buy bottom until the shorts are sent to oblivion.
Trouble is what do you do for an encore after a momentous squeeze.
A staggering 98.5% of NYSE volume was in advancing issues—an extreme breadth figure.
Predictably, bulls will seize that 98.5% statistic as “proof” that the decline is over and that a new bull market has begun.
Expect to hear that claim today, tomorrow and so on.
Nut for those sitting on significant unrealized losses, this figure is empty solace.
As the chart above showcases we saw a nearly identical session on Friday March 13, 2020—complete with similar breadth statistics—just before the SPX fell another 20% over the following ten days.
The bond market is this Spring’s Covid.
Why should foreigners keep buying US Treasuries? And will Trump’s backup on tariffs be enough to reassure them?
While we’re not forecasting an exact replay of that 2020 sequence, we highlight it to reinforce that sharp countertrend rallies are a hallmark of bear markets and serve to lure investors into premature optimism.
Yesterday I was looking for a rally to 525 SPY. When the SPY cleared 525 it triggered an hourly Rule of 4 Breakout.
So even in the turmoil, patterns trump the tape.
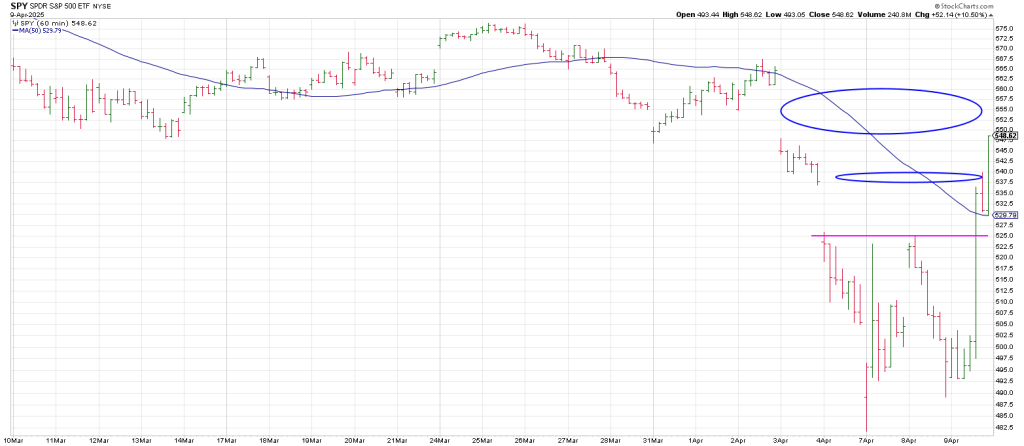
When the SPY catapulted above 525 it leapt another23 points or the equivalent of 230 SPX points.
Notice the Thrust, Pause, Thrust pattern on the hourlies after the SPY cleared its 50 hour moving average.
The 525 region is now the downside pivot.
Why is the 525 SPY (5250 cash) a big deal..
5260 is a cube (540 degrees) up off Monday’s 4835 low for the move. A low that probed the January 2022 top.
Mr. Market sure wants to make it seem like that was a picture perfect bullish play-book?
Let’s look at the “squares” up from 5260,
180 up is 5406.
360 up 5555.
Counting down from the all time 6147 high:
One cube down is 5685.
Two cubes down is 5240. There’s that 5250 region again.
Breakage below 5240 with downside follow thru is bearish.
The SPX went into the Minus One/Plus Two sell setup yesterday on trade above Tuesday’s high of 5267.
Constructively it continued higher.
While it would have been easy to turn the 3 Day Chart up on trade above Wednesday’s high today on an up open extension of the rally, instead the SPX is gapping down as I write this early Thursday.
The 3 Day Chart has not turned up since it turned down directly off the high.
That turndown was on February 24th.
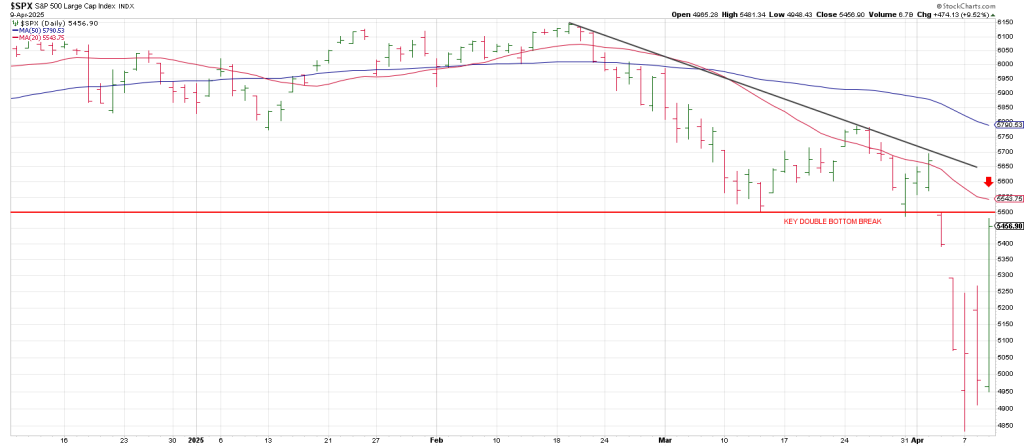
That said, the Weekly SPX shows potential “bullish” Train Tracks assuming this week closes near the top of the week’s range.
In sum, the bearish picture is that the SPX is backtesting the double bottom break that occurred on April 3rd on a gap. Until the gap from April 3rd is reclaimed, the bear remains.