“Crème tangerine and montelimar
A ginger sling with a pineapple heart
Coffee dessert, yes,
You know it’s good news
But you’ll have to have them all pulled out
After the Savoy Truffle.” Savoy Truffle, George Harrison
A big picture monthly SPX shows the first time the bottom rail of a trend channel from the 2009 low was tested was in the Covid Crash in 2020.
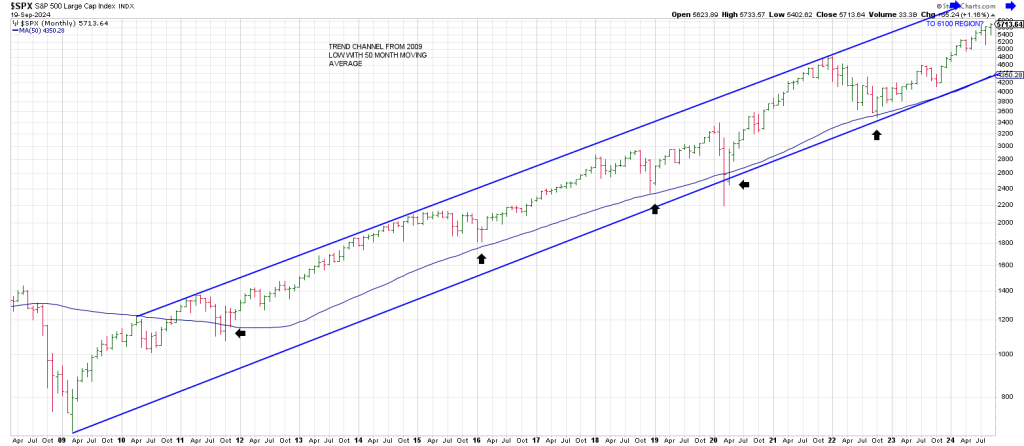
One of the factors leading us to make a forecast at that time that the SPX would rip to 4000 within a year was the presumption that this first test of the trend channel which having pulled the rubber band back to a test of the bottom of the channel would perpetuate a test of the top of the channel.
It did.
The drive to the top of the channel in late 2021 was the first test of the upper rail in 6 years.
In turn, that line drive, non-stop advance elicited a drop to the bottom of the trend channel in October 2022.
Amazing.
In the last 4 plus years it’s been trend channel whack a mole.
Should we rally to the top of the channel once again, it will tie to the 6100 region showcased in yesterday’s report equating to the range vibration from the 2007 to 2009 bear.
A failure to reach to top of the trend channel again, followed by a rollover in an impulsive 5 wave structure is a red flag that suggests a significant top has been struck.
Interestingly, a move to the top of the channel around 610 (6100) aligns with 349 (3490), the October 2022 low on the Square of 9 Wheel.
However, as flagged this month a nominal new high at 573 (5730) is an important upside pivot.
This is because 573 is one 360 degree rung up from 481, the January 2022 top.
This harmonic relationship between the January 2022 top and Thursday’s 5730 high potentially underpins my thesis that the drop into the October 2022 low was an A Wave decline with the next top satisfying a B wave.
If so the ensuing C Wave down will be a crash to the bottom of the trend channel to the 4350 region.
If I am correct about a C Wave, it won’t be an escalator down like 2022. It will take the elevator…with the bottom of the trend channel tying to 4350 over coming months.
In keeping with the mirror image foldback time/price work-outs from 1929 we have been outlining,
It is worth noting that 435 squares out with September 3rd, the 1929 peak.
Will a 25% waterfall style 1929 crash to the 4350 (435) harmonize with the high in 1929.
Interestingly October 28 and October 29th 1929 saw a near 25% decline.
The DJIA lost 22.6% on Black Monday, October 19th, 1987.
The SPX lost 30% on the same day.
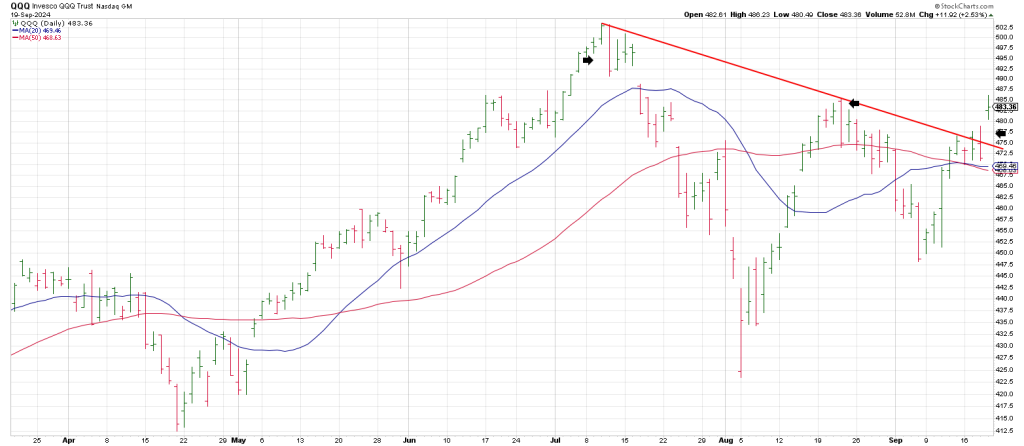
Earlier this week we showed a daily QQQ at well-defined resistance.
On Fed Day, Wednesday, the SPX left another signal reversal bar mirroring the July 11 bar and the August 22 bar.
Wednesday looked like the start of another leg down from a lower high, but apparently either Seller’s Remorse gripped players in their sleep or the rest of the world saw Jerry’s “emergency” cut as Rosie Scenario and not the Fat Lady singing.
Be that as it may we got a Reversal of a Reversal on Thursday or what I call a Keyser Soze, a diabolical signal named for the character in the film The Usual Suspects.
Like the Keyser, false moves lead to fast moves.
We got one, but it was all front-loaded on a gap.
The upside breakout in the Q’s must be respected until proven otherwise.
That said a drop back below Thursday’s QQQ open gap will trigger a Jump The Creek sell signal.
If that should play out, downside follow thru back below the trend line is a red flag.
Breakage back below the 20/50 day moving average Bowtie is a blaring sell signal.
For the moment, the breakout underpins the potential for the SPX to extend.
In sum, the Fed cut interest rates for the first time since March 2020. The cut was larger than the 25 basis point cut forecast by most.
Previously the only times that the Fed has cut rates by more than 25 basis points has been during moments of crisis.
The last time this occurred was during the early days of the Covid pandemic. Prior to that it had not occurred since the crisis in 2008.
So why did the Fed pull the trigger with an ‘emergency’ cut on Wednesday?
Either the economy is not doing as ‘fine’ as the MSM narrative goes or was a politically inspired move?
The Fed knows a 50 bps cut would foment a sugar high. Without a crisis, and an election just less than 2 months away, was it a ‘coincidence’?
Or, are we already in a recession as Jeffrey Gundlach says: “The level of debt on the consumer is very high, and so I expecft to see weaker economic data in the coming reports. I still think there’s a good shot that the history books will say September of ’24 was the start of a recession.”
If there is one unequivocal factor behind a bear market it’s the R word.
When Jerry says the economy is fine and we’re just “recalibrating”, is he talking smack?
Was the overnight ramp an international bid? Or was it The Hand smacking Wednesday’s reversal
day and bears taking Wednesday’s sell setup with a 2 X 4 in the back of the head?
Wednesday was an FOMC Cha Cha Cha for the record books—where the market whipsaws 3 times after a Fed move.
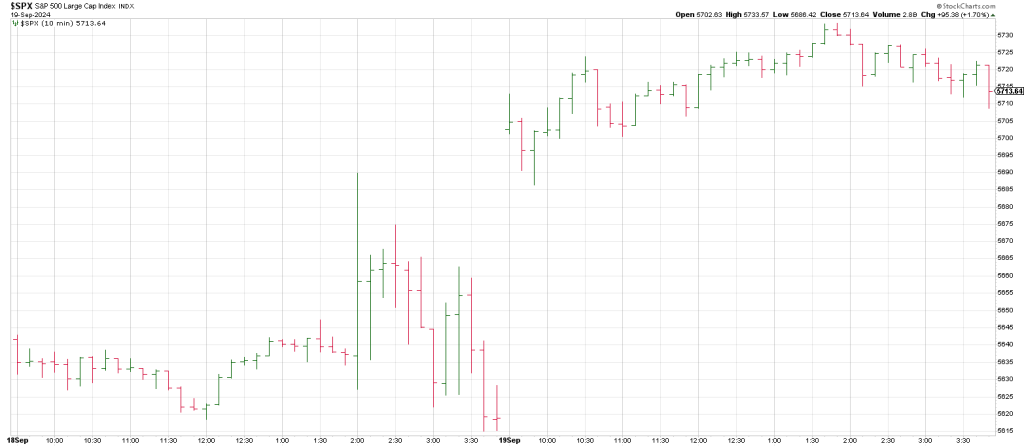
In contrast, Thursday went sideways following the huge momentum gap.
Was Thursday’s explosive turnaround after Wednesday’s sell day simply international markets having a different take on the Fed move…a 90 point SPX different take?
Or was it engineered?
The complexion of the next pullback will tell us much about the path ahead.
That being said, the Gann Panic Zone (in this case Buying Panic) counting from the August 5th low ends on September 26th. This ties closely to Gann Day and the Autumnal Equinox.
Tomorrow’s report will walk thru the momentous history of Gann Day.