The market gave little new information on Monday.
Thanks to the Roadmap we were not sucked into the idea of a Gap & Go to the downside.
That said, the Roadmap’s projections for volatility in the second half of the session didn’t pan out.
An hourly QQQ for July shows a little breakout attempt over a 3 point Tops Line for an hourly Rule of 4 buy signal.
However there was no upside follow thru, yet.
While the Q’s came in in the last 3 hours Monday, it was hardly the whipsaw that the Roadmap expected.
Yet, the Q’s did nose below the breakout line rallying into the bell to save the baby.
Notice that the QQQ 3 Hour Chart has not turned down since the July 9th all-time high.
That may change today as the Q’s have a 1 hour turn down as it tries to hold onto the breakout.
A second mouse breakage below the Tops Line may be enough to get the Algomatics annoyed and lighten up.
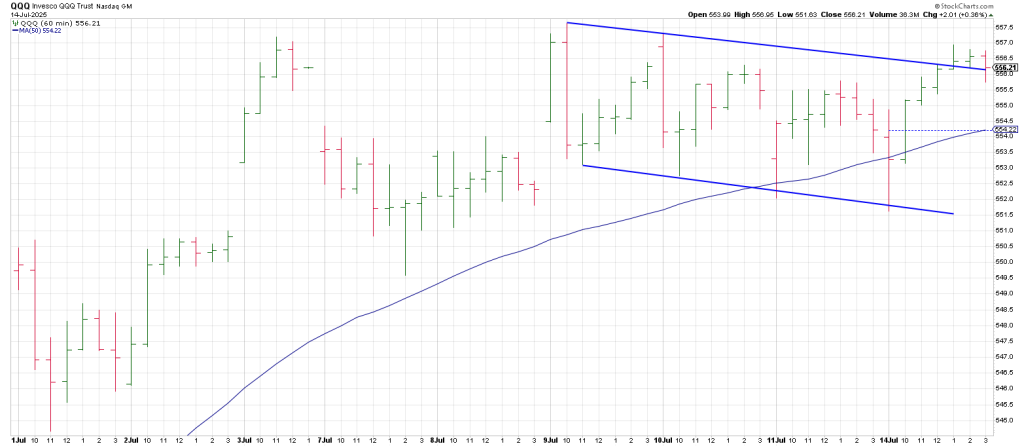
The 50 hour moving average has been tested/undercut twice since the July 9 peak in tandem with a test of the bottom of the channel. Downside follow thru below 554 and the 50 hour opens the door to a 551.
Not a big deal…except, we’ve been there, done that. In other words another drop below the 50 hour and the bottom rail of this hourly trend channel could perpetuate some downside momentum.
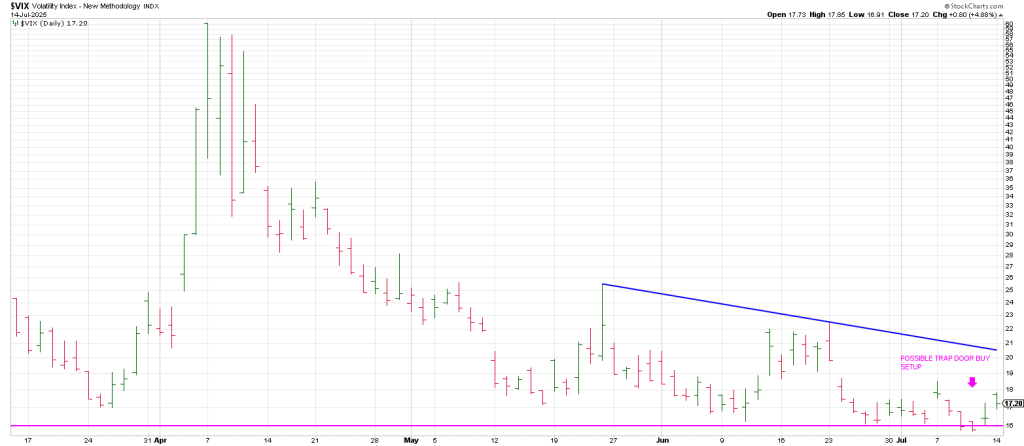
Someone sees it and is buying insurance: VIX was up nicely Monday and if it follows thru it will turn its 3 Day Chart up in the context of what may be a Trap Door.
More importantly, the QQQ 3 DAY Chart turned down yesterday leaving an outside down day.
A failure to get upside traction would be a conspicuous change in behavior.
Why?
The last time the 3 Day QQQ Chart turned down was on June 20th, the next day it slipped a tad lower byt left a 180/Holy Grail buy setup and exploded from there.
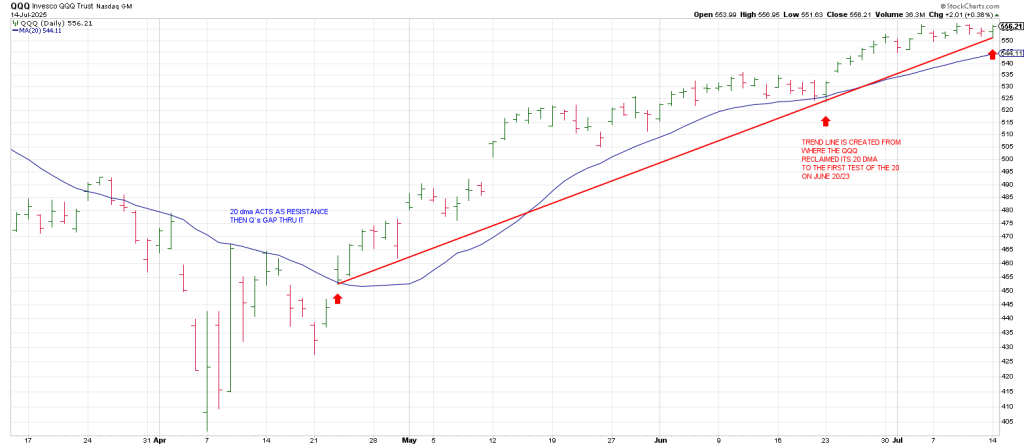
In sum the QQQ 20 day moving average has been breached since being recovered on April 23.
In fact it has only been tested once on the aforesaid June 20th test of the 20 day.
In sum, the action today is going to telegraph whether the Q’s are going to drop to 534 which is 90 degrees down from high.
This is where Phil D Gap resides.
The 20 dma is currently at 544; consequently if the 20 fails to act as support it opens the door to 534.
I refer to the 20 day moving average as the Holy Grail.
Alternatively, in the short term, the SPX has an unfulfilled square-out potential at 633 in this time frame.
Yesterday’s pre-market pullback could have been the beginning of the breakdown out of an Ending Diagonal,
But coming back immediately as it did suggests there is one more push to over 6300.
That coujld start today.
The takeaway is that a rally out of this “high-level consolidation” is going to foment euphoria, but Ending Diagonals reverse with a powerful flourish.
The daily QQQ shows a line created from where the Q’s first reclaimed their 20 dma on April 23 (notice the Q’s closed at their lows that day, looking bearish..but the next day surged—the Flying Elvis pattern.
The next point on the trend line is June 20/23, the only spot in the advance where the Q’s tested the 20 dma.
The third point on the chart ties to Monday’s low.
This is a stealth pivot. It’s going to get interesting.