“Plus ca change, plus c’est la meme chose.” Jean Baptiste Karr
“No stop signs
Speed limit
Nobody’s gonna slow me down
Like a wheel
Gonna spin it.” Highway to Hell, AC/DC
The Cycle due to top in late 2024 turns down slowly…as typically do all major cycles. During that period it doesn’t mean the market can’t make new highs. This is what has happened since the July QQQ peak—the Q’s have struggled for months to make a new high which it finally accomplished for the last 3 days.
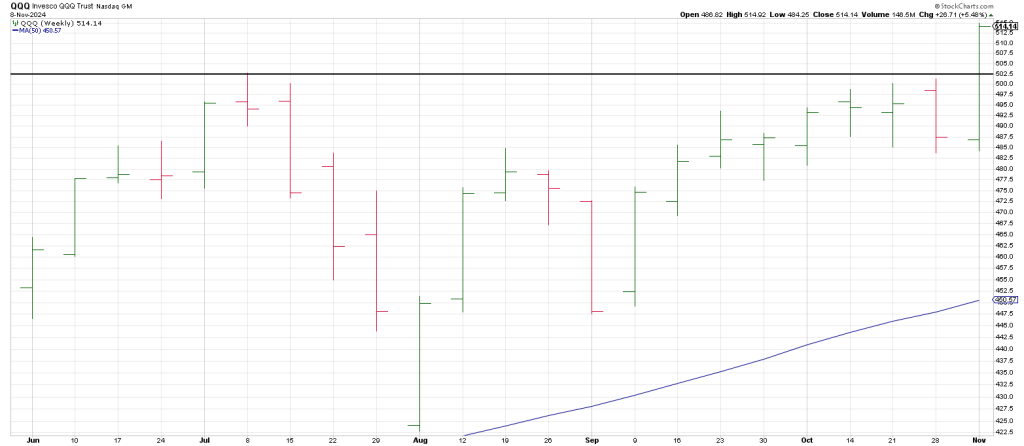
A reversal back below the July peak in November will trigger a weekly Soup Nazi sell signal.
In fact breakage below the July high before the end of the 2024 will trigger a monthly Soup Nazi sell.
A Soup Nazi sell setup is a strategy I developed to identify false breakouts. It is a new 20 period high followed by a reversal back below the high of at least 4 bars prior within the 20 bar lookback.
Even when the economy is slowing down we can still see market rallies—often strong ones.
Likewise divergences such as negative breadth and momentum can exist for long periods.
Such has been the case for months. Not run of the mill divergences but historic divergences which we’ve walked thru in this space over the past few months.
Examples of rallies when the economy is on the brink are late 1929, late 1972, early 2000 and late 1966 to mention a few.
Even during the Great Depression the DJIA rallied for 5 years from 41 to 195—a nearly 5-fold increase in the middle of the Great Depression.
It was NOT the start of a secular bull market; it was a cyclical rally.
Likewise the 5 year rally from 2002 to 2007 was NOT the start of a secular bull market. It too was cyclical in nature.
There is the market and there is the economy.
They are related, but they are different animals.
There are many important historic 5 Boom to Bust Cycles. For example:
1932-1937
1982-1987
1995 – 2000
2002-2007
In 2013 the SPX broke above its 2000-2007 double top.
It ran approximately 5 years into early 2018.
Let’s take a look at another ‘hidden’ 5 year period: the DJIA in the Roaring Twenties.
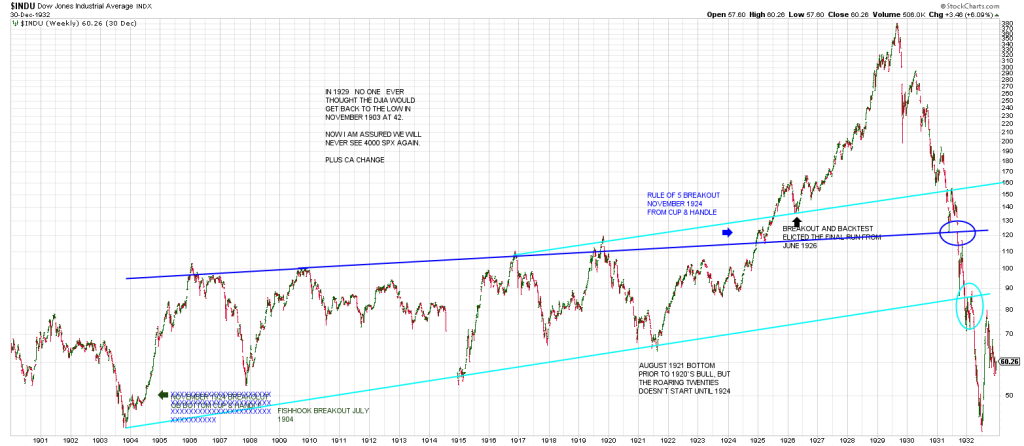
The first thing to notice is the low in NOVEMBER 1903 at 42.14,
It is followed by a Fish Hook breakout in July 1904.
I connected the 1903 low with the December 1914 low (turquoise trend line).
The market closed on July 31st. 1914, due to the outbreak of WW1 three days earlier.
It remained closed until December 12, 1914, accounting for the massive gap lower from 71.42 in July to the 53.17 low on December 14th.
This past July 31st we had Air Pocketism from 40,842 to a low of 38,499, a 3 day drop of 2343 points on the anniversary of the swoon that started 100 years earlier.
100 Year Cycle? We’ll get into that below.
Continuing with the turquoise Bottoms Line nails the August 1921 low.
This is a major low, the low preceding the run up to September 1929.
An 8 year period or 96 months.
Interestingly 96 is due north on the Square of 9 Wheel and squares-out with September.
It is important because all the numbers that are due north/south or east/west are on what is called the Cardinal Cross. These numbers are on the seasonal axis of the Spring Equinox, the Summer Solstice, the Autumnal Equinox and the Winter Solstice.
Hence 96 is on the Season Axis.
All numbers on this axis have more ‘natural’ strength to present potential turning points be it in price or in time…especially in months as is the case with 96 months for the 1920’s.
Did anything happen 8 years ago?
In November 2016 the DJIA broke out of a 2 year wide and loose range.
From that coil an uninterrupted rally of 8,216 points or 45% in 15 months.
From the 28,661 October 2022 low the DJIA has advanced 54% to last week’s 44157 high.
If it should rally another 1% to around 44,500 it will satisfy in percentage terms a Gann Panic of 55% (buying panic).
Interestingly, that would equate to the SPX tagging our 6100 region projection.
But going back to the early 1900’s chart.
Once I produced the 3 point Bottoms Line (turquoise), I paralleled a line from the high in 1919.
This is the high before the low, the big 1921 low.
Notice extending this line marks a point of Accelerated Momentum in 1925 when price broke above the turquoise channel.
Price backtested the channel in March 1926 and rallied sharply carving out a Cup and Handle.
When the DJIA came out of the Cup and Handle in May thru July 1927 the melt up started.
The DJIA would nearly double in 27 months.
The dark blue line defines the top side of a 19 year wide and loose range.
Long time readers are familiar with my Rule of 4 Breakout strategy.
It is a break out or a break down from a 3 point trend line.
It works because you typically don’t find quadruple tops or bottoms.
The 4th time thru seals the deal for a directional move.
In this example though in the early 1900’s we get 4 tops along the line.
Interestingly on the 4th attempt through you get a false breakout and a deep decline of roughly 50%
That’s from a NOVEMBER 1919 peak of 119.62 to the August 1921 low of 63.90 (8 squared) in 21 months.
In fact it is referred to as the Depression of 1920-1921.
Who would have predicted that from the depts. Of that depression the DJIA would rally 6-fold to 386 almost exactly 8 years after the 1921 low?
As Hit and Run members know 6 represents a cube, a true square, a true square having 6 sides.
“All major highs and lows are square-outs.” W. D. Gann
I am always amazed about how most folks call the analysis of the geometry of the market voodoo.
It is undeniable.
When the DJIA failed to find support at the extended upper turquoise line on the other side of the Matterhorn it indicated acceleration of the decline.
Notably this was in 1931 well after the crash.
When the dark blue extended line (I call these extended lines into the future Ghost Lines)snapped in mid-1931 the market accelerated even more..
The failure of the Rule of 5 Breakout to produce any kind of rally was a technical point of recognition.
It was an indication that the entire parabolic move was going back to generational low… from nearly 30 years prior at 42 in 1903.
When the lower turquoise last ditch support broke in early 1932, the DJIA was cut in half again sliding to 40.15 in 7 months.
Breakage below the lower rail of the turquoise trend channel opened the door to the lows of 28 years prior.
In 1929 no one ever thought the DJIA would get back to the low in November 1904 at 42.
Yet it was actually undercut.
Now I am assured by people in the twitter/X sphere that we will never see 4000 SPX again!
4100 was the October 2023 low…just 1 year ago.
You want to go back to generational lows— you’re looking at the 1994 low of 442 SPX in December of 1994.
That’s the low prior to the 5 year parabolic run into March 2000.
It’s actually an undercut of the March 2009 low of 666.
But let’s call that 440 to 670 region a band of support as it represents a 15 year period.
That impulse from January 1995 is a generation ago.
This January is 30 years.
But generational lows don’t ever get tested, right.
The 1962 DJIA low was 524. Twenty two years later in December 1974 the DJIA struck 570.
People want to know what the ‘reason’ such a generational decline would be.
Narratives are simple. Life is complex.
Most market participants operate from the threshold of logic when the market is a psychological animal.
“First principle: any explanation is better than none. Because it is fundamentally just our desire to be rid of an unpleasant uncertainty, we are not very particular about how we get rid of it: the first interpretation that explains the unknown in familiar terms feels so good that one excepts it as true.” Friedrich Nietzsche
The Cycle indicates a recession is around the corner.
It must be said that although The Cycle has been very accurate in the past in predicting certain market conditions we have to take into consideration the devaluation of money by the increase of the money supply and free money, ZIRP.
But The Cycle does give a good estimate of which PERIODS you can expect major highs and major lows in the financial markets.
Think of the market bucking The Cycle in the last stages and registering negative breadth and momentum as a Star Burst pattern.
Interestingly, the same phase of The Cycle, was pointing to a low in November 1987.
The market crashed in October and struck its price low in December.
We get the same phase in January 2025.
That means the market could top at any time. This same cyclic aspect could exercise its downside influence slowly then all at once.
Last month I walked through a discovery of a time factor that has often triggered market events…in either direction.
This January has several of these ‘hits’.
So we have confluence between these two over coming months.
I would not be surprised to see the market register a high in November and pullback followed by a test of the high in January before turning down in earnest.
We will be showcasing what The Cycle indicates going forward in these reports as it validates itself.
Suffice to say there are interesting turning points in September 2029, the 100 year anniversary of the Great Crash as well as October 2032, which is the 100 year anniversary of the Great Depression PRICE LOW.
Allow me to re-emphasize that these idealized turning points have an orb of influence and do not necessarily represent the week of a turn but can exert their influence months before and after as depicted in the examples above.
Above I mentioned a confluence of time factors due to hit in January.
Of course that is when Trump takes the oath.
The question is now that the market “dog has caught the car” and euphoria has broken out now that the election is behind us; what does the dog do with the car after this “buy the news rally?”
Since the summer lows we have kept the door open for potential to 6100 + on the SPX.
Below is a monthly SPX with a trend channel from the March 2020 Covid Crash low.
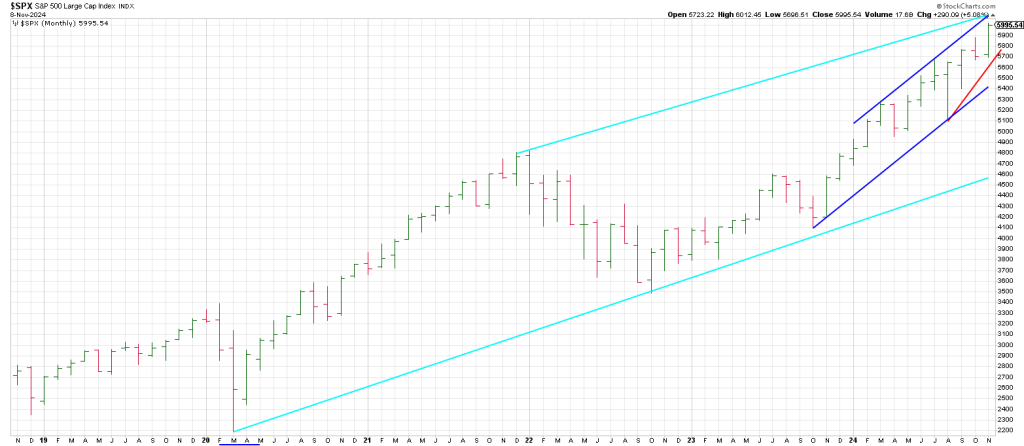
I connected the March 2020 low with the October 2022 low.
I then paralleled a line from the December/January 2022 top.
You can see that currently the top rail of the channel ties to the 6100 region.
As well, there is a dark blue trend channel created from connecting the October 2023 low and the August 2024 low that intersects at the 6100 region.
Remember these are monthly channels so its potentially major resistance.
I drew a rising trendline from the August low that ties to the price region just below 5700.
Of course the low 5700 level was our projection in mid-October as it is 180 degrees down from the mid-October high.
We stated that a shakeout that held 5700 and the summer peaks at 5650-70 would likely pull the rubber band back prior to an explosion to new highs near 6100…if that was on the table.
In addition to the trend channel from the 2020 low, there is a trend channel encompassing the melt-up from the October 2023 low that points to the 6100 region.
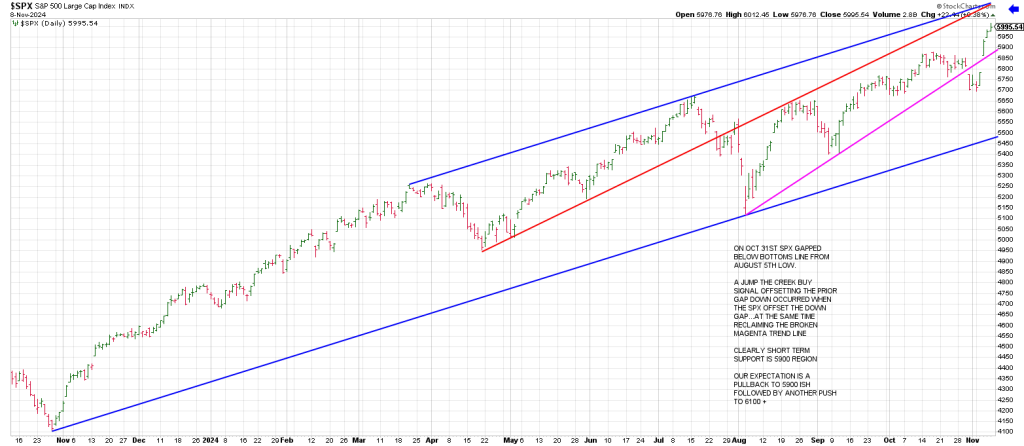
Notice the intersection with the top of the channel and the red Ghost Line from the April low.
The magenta trend line depicts the Halloween trick false Rule of 4 Sell.
The massive upgap last Wednesday left an Island Bottom as it broke out above the October highs.
Short term support now is 5900. I would not be surprised to see a minor wave 4 pullback to the 5900 or so region this week.
Then the 5th wave fling to 6100 +.
As well, there is a Measured Move on the table:
From the march 2020 SPX low of 2192 to the January 2022 to is 2626 points.
From the October 2022 low of 3491 +2626 points is 6117.
Additionally, the last major low of 349 (3490) from October 2022 is on the same axis as 609 (6090).
Notice how they point to early January.
While some want to shoot the messenger calling the Square of 9 Wheel voodoo and claiming that I am a perma bear, I am anything but. The facts speak for themselves..especially when it comes to taking long swing setups despite seeing a litany of Signs of the Bear.
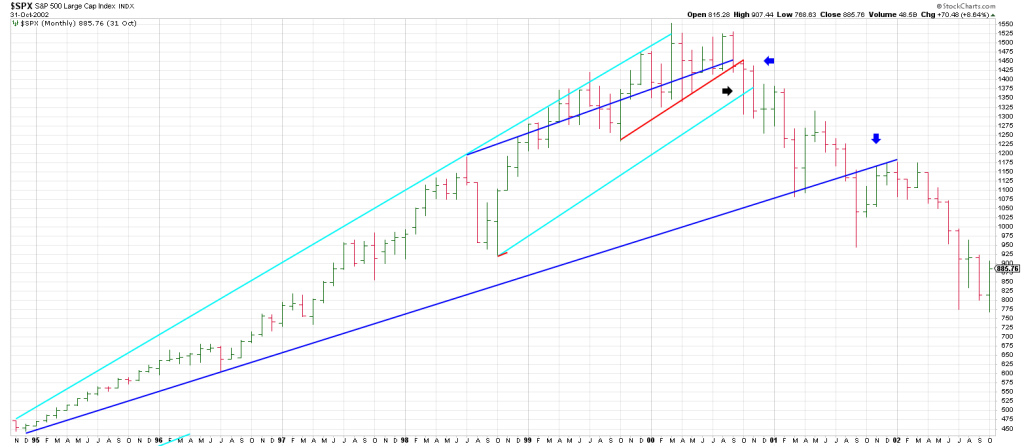
On October 8th, 2002 Hit and Run wrote that the bear market was over.
The SPX bottomed on October 10th leaving a Key Reversal Day.
The market rallied 5 years.
On March 6th, 2009 Hit and Run wrote that the bottom was in.
On March 23rd,2020 at the SPX 2191 Covid Crash low, Hit and Run wrote “from here the expectation is a run to over 4000 within a year.”
In sum, Since September professional money managers told clients caution was warranted due to rising interest rates, then it was uncertainty about the election and the Fed.
Now the “pros” have no choice and are rationalizing performance chasing.
They cannot afford not to be there for a year end rally.
Performance is all there is in the universe of money management.
When the S&P 500, the benchmark, by which performance is measured is up sharply for the year, pros begin to get nervous if they are lagging. They begin to press.
In reality, the real pros are likely gaming the game and “buying ‘em to bang ‘em”.
It’s a stampede to turn around to distribute to the suckers.
The election was fair game as a catalyst to stage the ambush.
The Halloween shakeout set the hook.
What about the old Wall Street saw that the market loves a divided government so they can’t do too much? Well the GOP has run the gauntlet.
Above we discussed the 5 year cycle and the approach to the top of a 5 year channel from the March 2020 low.
Let’s look at the trend channel into the 2000 top.
Following the sharp shakeout into October 1998 the SPX rode the top rail of a trend channel into the March 2000 top.
Is the October 1998 low similar to the October 2023 low?
Notably, the bear market didn’t start in earnest until September 2000.
This is when the SPX broke below the top of the dark blue channel coincident with a one year trend line (red).
The dark blue trend channel is important as it is defined by the December 1994 low and the 1996 summer low…the first pullback in what would become a 5 year rip.
Notice how the first leg down in the bear into March 2001 test the bottom rail of this dark blue trendline and that the second leg down is defined by a backtest of the bottom of this channel in December 2001.
The top of the current channel should define a major high as well.
By next spring I suspect this spike will be called the Chump Trade…not the Trump Trade.