“Surf’s up
Aboard a tidal wave", Surf’s Up, The Beach Boys
“There are old trader and there are bold traders, but there are very few old, bold trader.” Ed Seykota
Last week the SPX left a signal reversal bar on the weekly time frame.
It left a 10 week Topping Tail or what I call an Iguana sell signal versus a Lizard sell signal which is a 10 day Topping Tail on the dailies.
A Topping Tail is a bar with both the open and close near the bottom of the range following a run-up that tails off.
This is the third weekly signal reversal bar on the SPX since the April low.
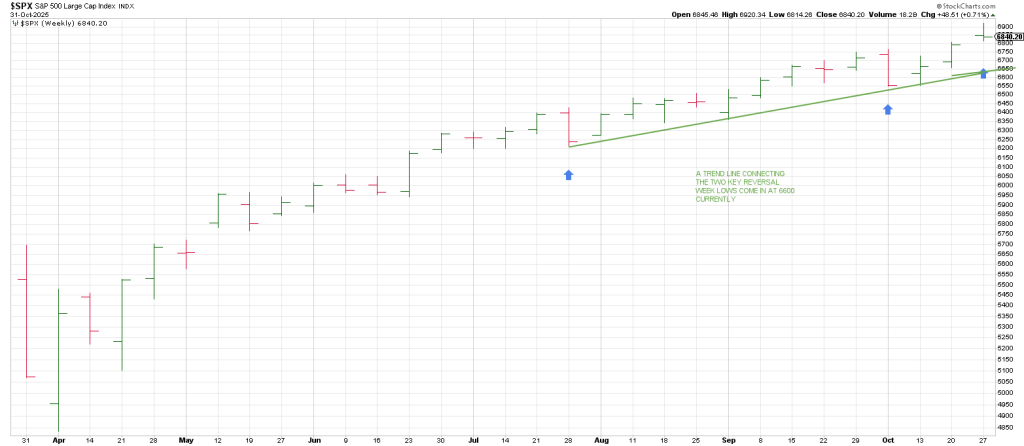
We got a Key Reversal Week on the week of July 28 and another Key Reversal Week on the week of October 6.
Neither elicited downside follow thru whatsoever. A clear sign of a Runaway Move in progress.
In fact the Key Reversal Week from the week of Oct 6 is the only instance of two consecutive lower weekly lows since the April low.
This is because there was brief and minuscule follow through from the Oct 6 Key Reversal Week.
Amazing.
Think about that two Key Reversal Weeks in the midst of a vertical move and neither perpetuated
A meaningful pullback.
This is truly a runaway train.
Will the third time be a charm for the Bear?
To recap, this week is pivotal time wise.
We have a natural cycle that occurred on Sept 8, 1929 and August 29, 2000 that occurs on November 4.
Obviously the two prior instances coincided with major tops that saw an 80+ % drop in the DJIA and the second an 80+ % drop in the NAZ …both in a few years.
I think there is a strong likelihood this could happen again over the next couple of years.
At least that’s what the cycles suggest.
As well, remember that the year 2025 squares November 7 and that the Great Secular Bull Market started 43 years ago.
43 squares November 7.
A Great Secular Bull Market stated in 1949 that ended 17 years later in 1966.
The Primary Low of the last major bear market was on November 21, 2008.
That is when the NAZ struck low.
November 2025 is 17 years from November 2008.
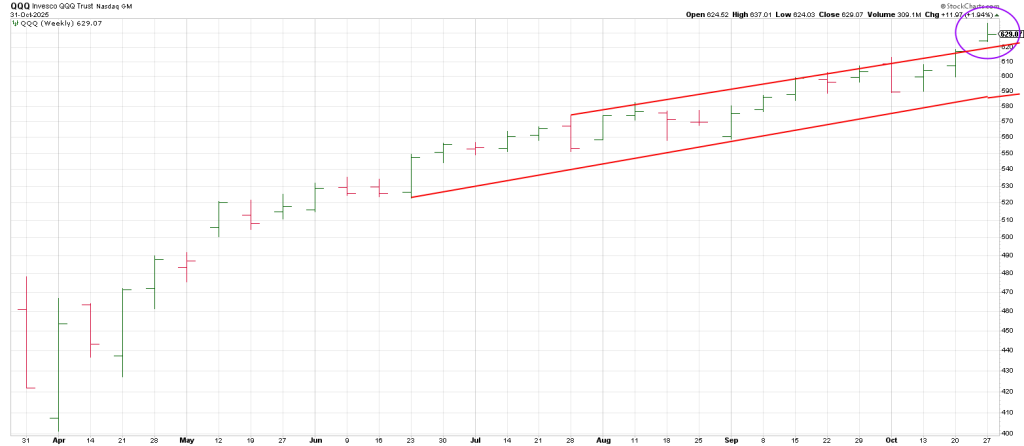
The Q’s got down to 25 in November 2008.
Last week they struck a high of 637, closing at 629.
10 revs of 360 degrees up from 25 is 626 and aligns with Nov 7.
The Q’s bottomed at 402 in April 2025.
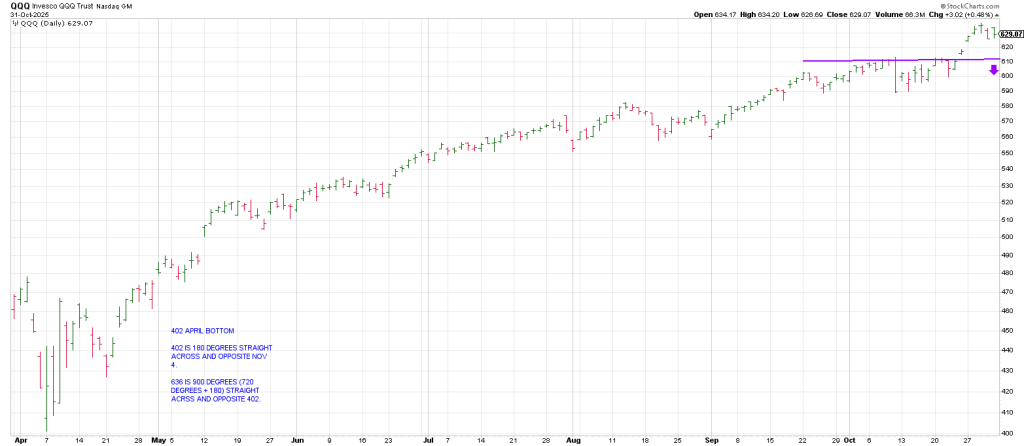
402 is 180 degrees straight across and opposite November 4th.
626 is 900 degrees straight across and opposite 402.
So last week’ 629 reversal week close on the QQQ is interesting.
If we get downside follow through below last week’s upside gap that sticks the market may be talking.
For its part the SPX turned its 3 Day Chart down Friday with 3 consecutive lower daily lows.
This is only the 6th time this has occurred since the April low and each instance has defined a low.
So with this week being important time-wise it should be critical to see how the SPX behaves.
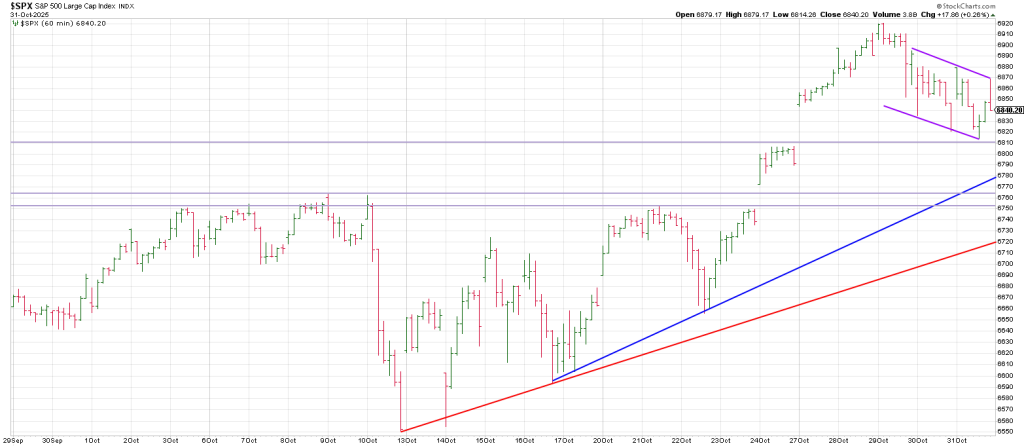
Initial support on the hourlies I Friday’s low where the index may have trace out a Bull Flag with 3 little drives down into Phil D Gap from October 27.
Below that is the 6750-6770 region.
Below that 6720.
In sum, November looks important.
If the turn down in the 3 Day Chart Friday marks another buy point, then this week squares out with 703 or (7030).
At the same time, 716 (7160) vectors the 218 SPY low from the Covid Crash low in March 2020.
We are winding up the 5th year from the 2020 bottom.
5 year advances are synergistic in the markets DNA.
In the summer we used a chart showing the Roaring Twenties Bull Run was actually 5 years from 1924.
This mirrors the 5 year melt-up from 1995 to 2000.
There are several harmonics and cyclic connections between 1929, 2000 and 2025.
One that we had not noticed before is that it was 71 years from the 1929 top to the 2000 top.
It took 25 years until 1954 for the DJIA to exceed its 1929 top.
1954 plus 71 years is 2025.
So a sort of “hidden pivot” high to ‘high’ to high may be in progress.
It took 25 year for the DJIA to clear it 1929 peak.
We know that 25 years is half the Jubilee Cycle.
From the 1949 start of a Secular Bull Market + 25 years is 1974, a major bear market low.
Late 1974 + 25 years is late 1999.
We are 25 years from the 2000 top.
A monthly SPX from the 2020 low shows a possible Throw Over false breakout.
A reversal below the top rail of the trend channel is a warning.
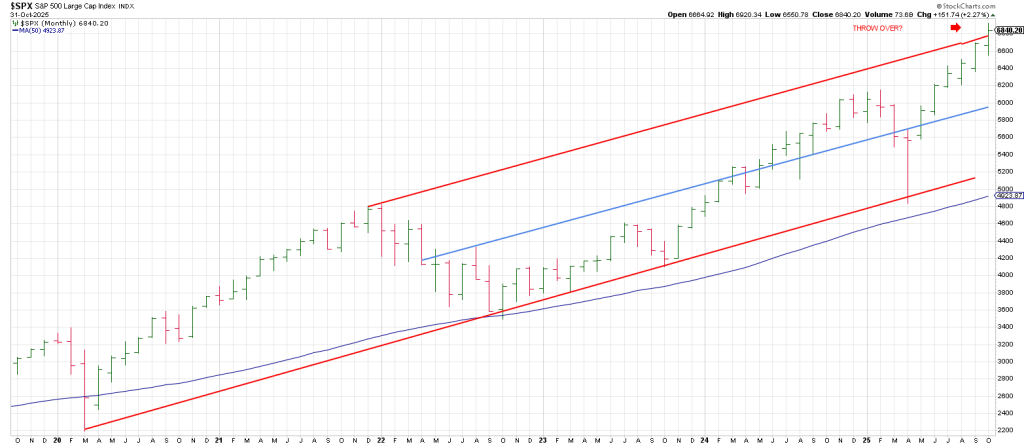
From my perspective a bear market will see a drop to the bottom of the channel at 5200-5300 and then a possible counter-trend rally to the mid-channel line (blue) putting in a big picture Right Shoulder—-the Left Shoulder being the Feb 2025 peak.
While intermediate support may be well below current levels at 6500 and then the 6150 region, any break that is impulsive (5 waves) warrants caution.
Likewise a turn down in the 3 Week Chat that last happened in March 2005 that does not define a low
Is a warning.