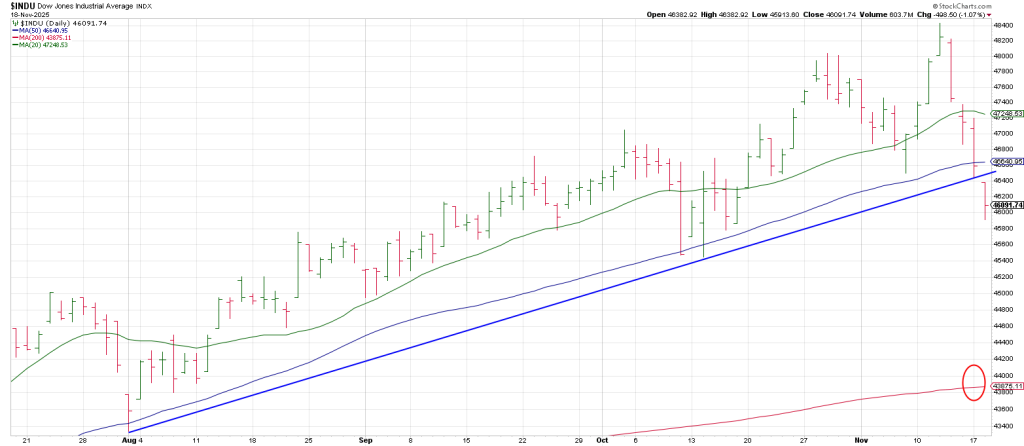
On Wednesday last week, November 12, the DJIA struck a new all time high all alone.
We noted that the 48,431 high mirrored the SPX 4835 April 7, 2025 low.
There are a lot of time/price harmonics and inversions at major turning points.
That November 12 DJIA high was a text book example of the 3 Day Spike Rule.
The subsequent action was the Mother of Rug Pulls cementing what may end up being a Buying Climax for the ages.
Was it destiny?
The 484 (48,431) high is 180 degrees straight across and opposite November 12, the high day.
Amazing.
The day after the high the DJIA knifed below the prior swing high triggering a Soup Nazi sell signal.
The DJIA is still plunging.
Talk about fast moves coming from false moves.
This was a doozy: The DJIA sliced though its 20 and 50 DMA’s 2 and 3 days off the all-time high respectively.
Sure makes you think the ramp was orchestrated for “someone” to sell into.
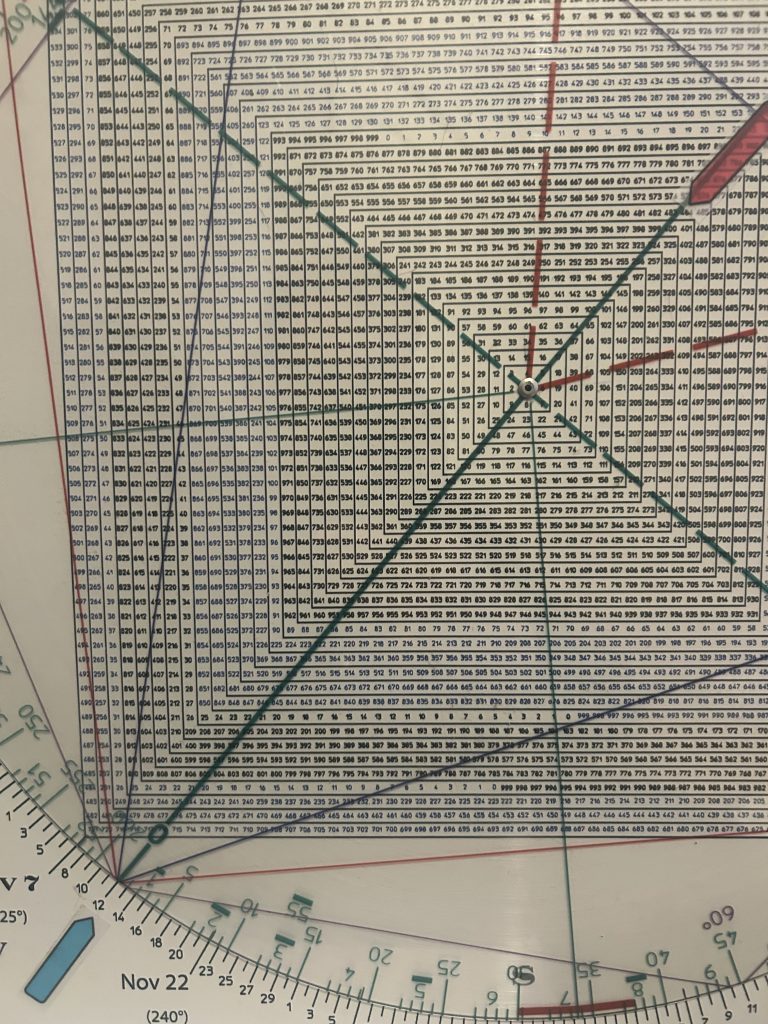
On the same day Nov 12, the QQQ put in what looks like a right shoulder.
Yesterday the Q’s broke the Neckline.
The projection is 557.
Let’s see how that ties into the squares coming down off the 637 high.
180 down is 588. The Q’s hit a low of 591 yesterday—closing below the Neckline and just above 588.
Will we see 588 today—before or after the NVDA print?
270 degrees down is 564.
360 degrees down is 540 with the 200 DMA currently residing at 542.
As long as the QQQ remains below its 50 day line and especially 599, pressure remains down.
It looks like there is a strong likelihood the QQQ is going to test its 200 DMA.
The last time the Q’s were at their 200 DMA was in early May when they blew though it with a massive gap.
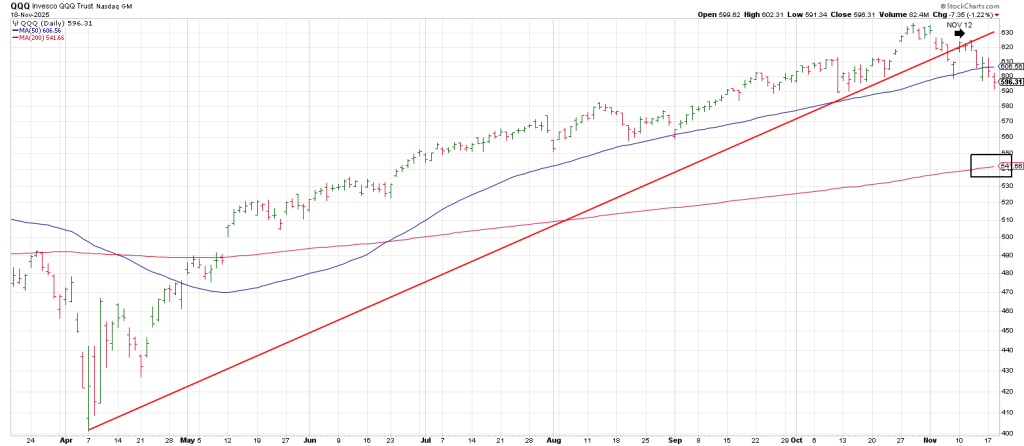
The 200 DMA is a big deal…whether it’s in the market’s DNA or self-fulfilling narrative.
With META, MSFT and AMZN in free-fall, a lot is on NVDA’s shoulders after the close today.
It’s perched precariously on a Bottoms Line from Sept 5.
Since its debut in 2009, bitcoin has roughly tracked the SPX.
Bit, bitcoin topped more than 5 weeks ago on Oct6 and has been descending quickly.
The likelihood is bitcoin is leading the way.
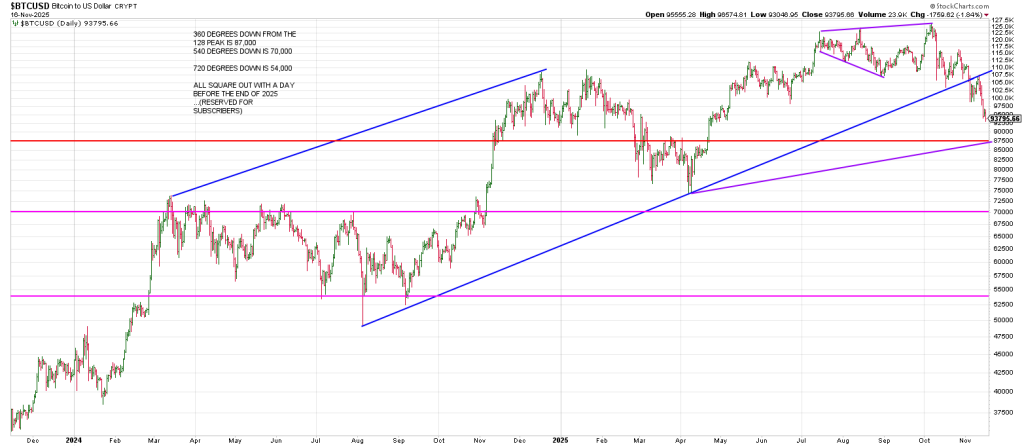
Bitcoin topped at 128,000 on October 6.
The Gann Panic Zone 49 to 55 days from that high is November 15 to 27.
360 degrees down is 87.000. Yesterday it hit a low of 88,000 and bounced leaving a Lizard buy signal.
Breakage below 87,000 opens the door to 78.000 to 70,000.
The bitcoin daily from the other day shows the 70,000 pivot.
Below 87,000 bitcoin could crash to 70,000 before the end of November.
Some time/price cycles are predetermined. When we get a glimpse through the Eyes of the Wheel our confidence and profits increase.