“Nobody’s perfect”
Why study market history?
As Jesse Livermore stated, “Nothing new ever occurs in the business of speculating or investing in securities and commodities.”
Except now. This is the first time in history in which the Fed is cutting interest rates in an extremely overbought bull market…two years in progress.
The Fed has an agenda: despite Friday’s jobs report being hotter than expected there is now an 87% probability of a December rate cut according to Fed futures.
Despite Friday’s jobs report being hotter than expected, the SPX struck a record high on Friday.
Some like it hot.
A Fed rate cut now would be a mirror image mistake of their hike in 1929.
It would be pouring fuel on an epic speculative fire.
Nobody’s perfect.
But the market is betting the Fed is just at a time when they are teetering on losing control.
To wit, the Fed cut rates 50 basis points on September 18th and 10 year yields proceeded to rally from 3.64% to 4.50% on November 15th.
TNX is in the Weekly Plus One/Minus Two buy position (suggesting another turn to the topside) from its 50 week moving average.
Despite TINA (There Is No Alternative …but stocks) abdicating the thrown to TIAA (There Is An Alternative ….risk free US Treasuries), some like it hot. Market participants prefer to play with fire…just at a time when cycles warrant caution.
The 5 year or 60 month cycle is one of the most powerful in the market.
It is a division or fractal of Gann’s Master 60 Year Cycle.
Twelve 5 year cycles make up the 60 year cycle.
Twelve relates to time as there are 12 hours on the face of a clock or watch.
As well there are obviously 12 months in a year which is based on the 12 full moons in a solar year.
Examples of the powerful 5 year cycle are:
- 1932 to 1937 five-fold advance in the DJIA. This was in the midst of the Great Depression. Yet it took another 12 years until 1949 before a secular bull market started in earnest. Was there anyone at the top of the 5 year advance into March 1937 that did not believe things had returned to normal?
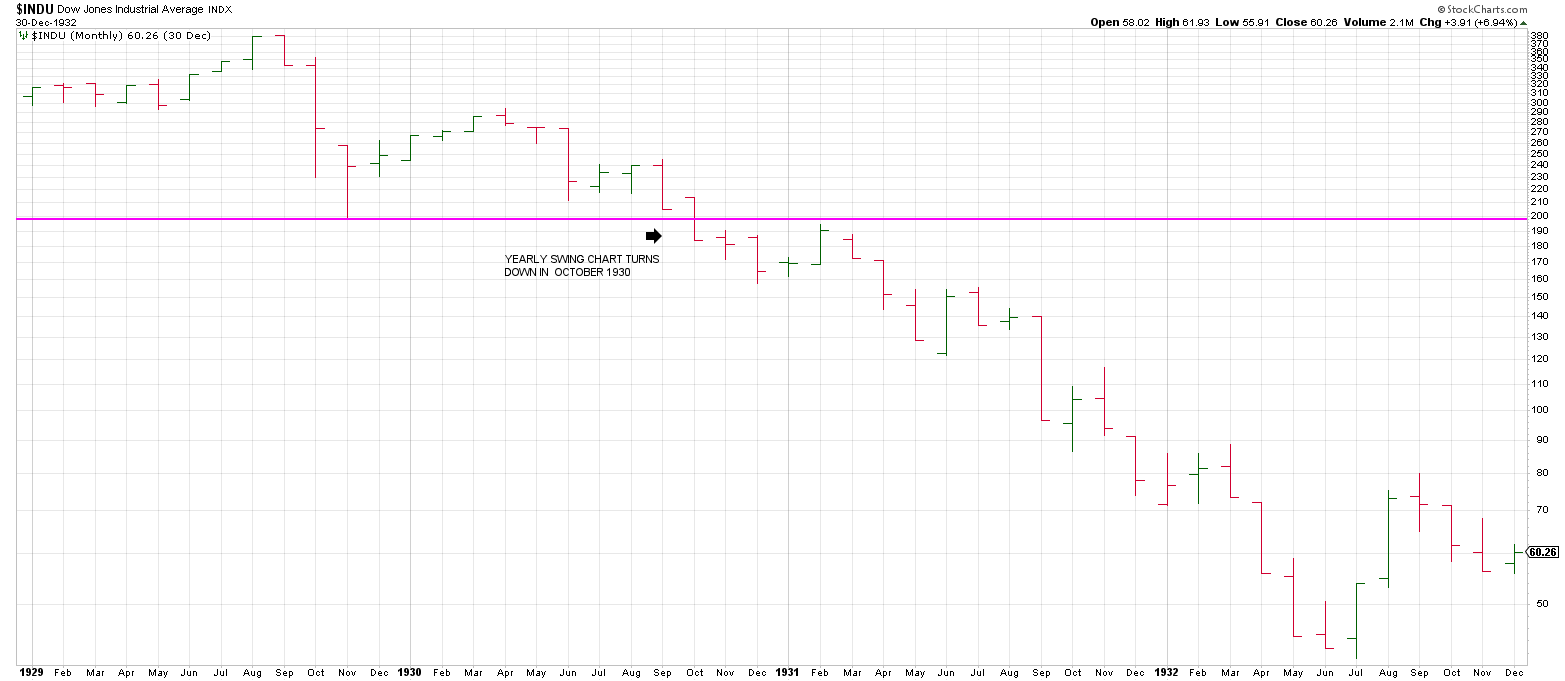
Yet the DJIA dropped from a high of 195 to 97 in exactly one year…further dropping to 92 in 1942, FIVE YEARS FROM THE 1937 TOP, precisely.
- Into the overlapping cycle into June 1949 a 60 year low to low cycle played out into March 2009.
- Measuring from the 1949 low, the 5 year cycle was due to exert its influence again in 1961. The DJIA topped in November 1961 at 741 and rolled over crashing for 3 months in April, May and June 1962. The DJIA dropped from 707 in March 1962 to 524 in June 1962. A 30% drop. A Covid-like drop. Interestingly, the DJIA marched higher in a virtually straight line fashion from the June 1962 low into January 1966, the start of a secular bear market.
The DJIA advanced from the 524 June 1962 low to 1000 in early 1966.
The top in 1966 was 5 years from the 1961 low.
Was there anyone in early 1966 that didn’t think it was a ‘return to normal’.
Yet as we know a 12 year decline played out into March 1978. Yet it took another 4 years where the DJIA carved out a triple bottom until a secular bull market unleashed.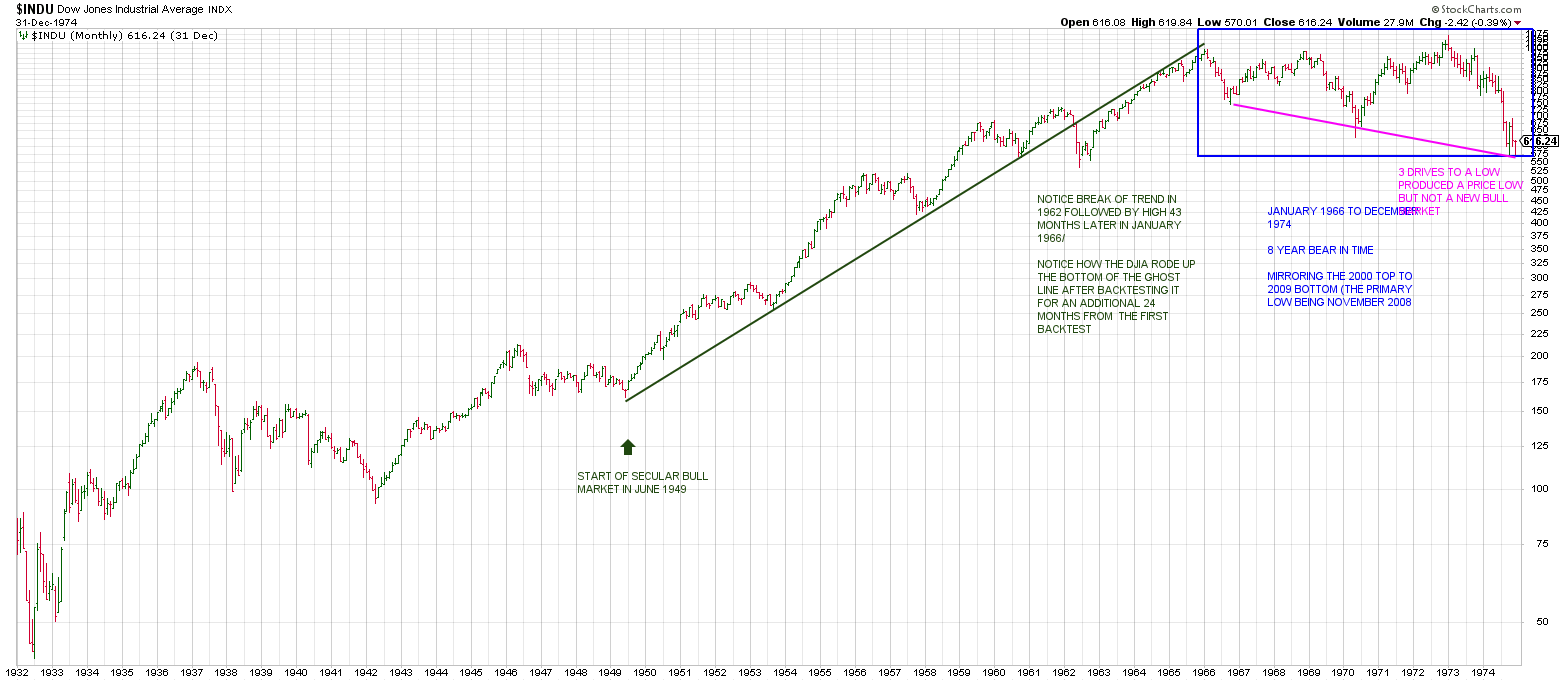
- Another powerful 5 year advance took place from August 1982 to August 1987. The market crashed.
As mentioned above cycles are overlapping, like a Double Helix.
The DJIA broke out in October 1985 for a 2 year run into August 1987.
5 years from 1985 is 1990 when markets crashed 20% over 3 months again mirroring the drop in 1962.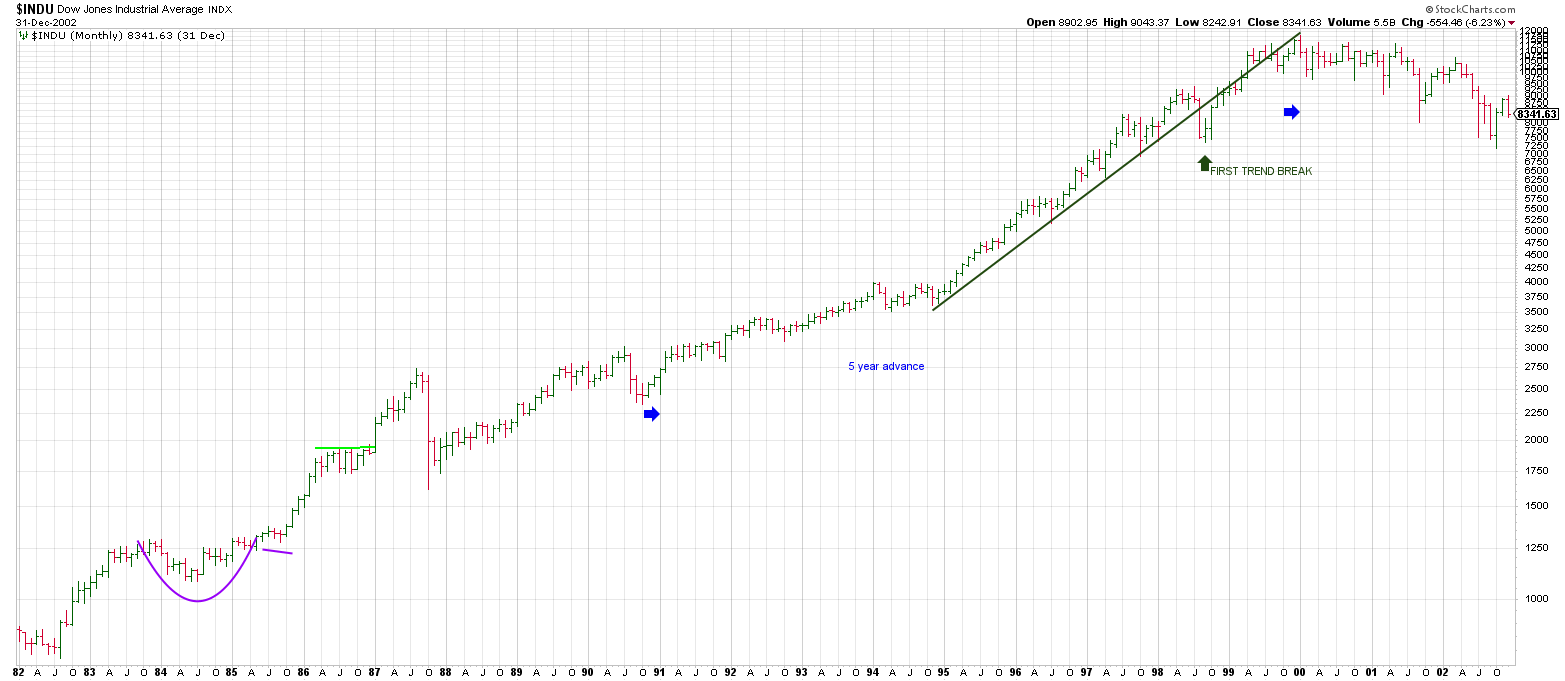
- From the 1990 low the 5 year cycle struck in late 1995. A 5 year vertical run ignited. The DJIA topped in January 2000.
- 5 years later in late 2005 the powerful advance started into the October 2007 top.
The 60 Year Cycle bottomed in 2009. The 60 Year Cycle over-powered the 5 year cycle due in 2010.
But, notably the first pullback low off the March 2009 played out in June/July 2010.
So we have a confluence of cycles from 2009 (the 60 Year) and 2010 (the 5 year) due to hit in 2014/2015.
What happened?
A short-lived air-pocket in October 2014 heralded a rollover into August/ September 2015. That low was tested 180 days/degrees later early 2016 . The 5 year cycle had exerted its influence again: 2010 to 2015.
The 5 year cycle was next due to culminate in 2020.
Notice that he high in 2015 occurred in February.
The pre-crash top in 2020 was in February.
It is important to note that the DJIA had a double top breakout in January 2013 and that 5 years later in January 2018 we got a major top and Volmageddon.
2018 was a year of market spasms that ended with the Christmas Crash in 2018.
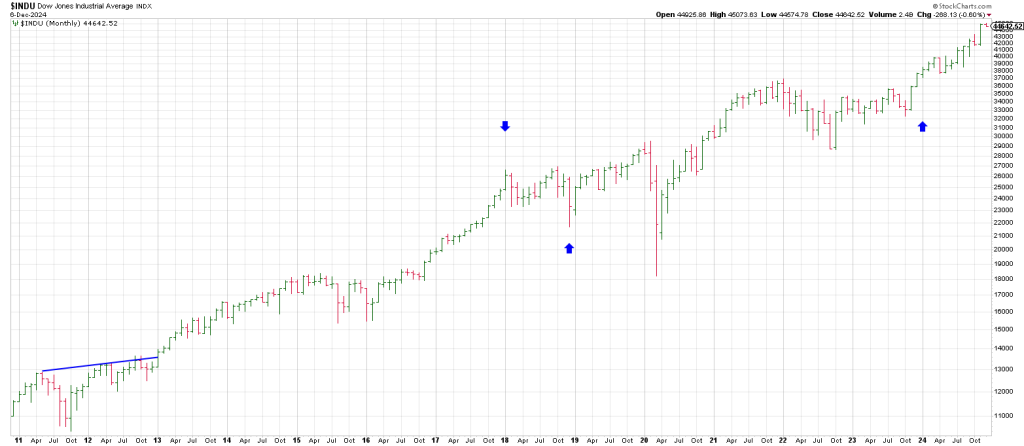
Consequently, we have a 5 year cycle that was due to hit in early 2023, the 5 year anniversary of the January 2018 peak and in December 2023, the anniversary of the December 2018 low, respectively.
What happened?
The market exploded off a low in October 2022 carving out a successful pullback low in March 2023.
In late 2023 we got a major low in late October perpetuating a monumental rally which is still in progress.
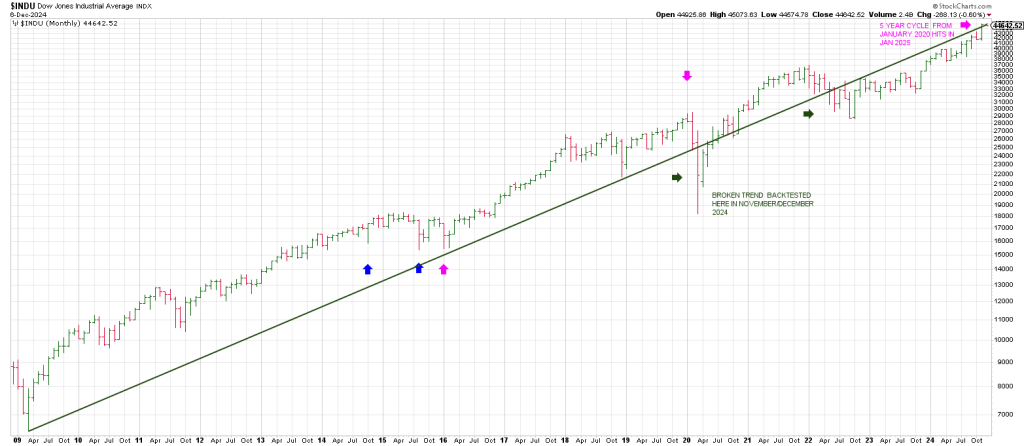
That said, 5 years from the January/February 2020 pre-crash top is early 2025.
Is there anyone left who doesn’t think the market has returned to “normal”?
Are there any market participants who don’t think we’re in the early innings of a new bull market that started in late 2022?
There are many alarm bells blaring as to valuation and breadth and momentum divergences.
They are not timing tools. They won’t tell you when The Turn on the table.
They will only tell you when the condition is ripe.
The 5 year cycle and the 60 year cycle from 1966 loom large.
While arguably, taking the 60 year cycle into consideration, there is another year into 2026 allowing the market to rally/hold up, the 50 Year Cycle, the Jubilee Cycle may make its presence known at any time.
From the 1932 summer low the 50 Year Cycle produced a bottom in 1982.
50 years from the December 1974 low is December 2024.
1932 and 1974 are the two biggest cycle lows in the last 100 years.
And the market ain’t at a low.
Risk is ripe.
We all know markets can stay “irrationally ripe” at lows and at tops longer than we can remain solvent.
But that also means that any top could be a Tent-Pole Top.
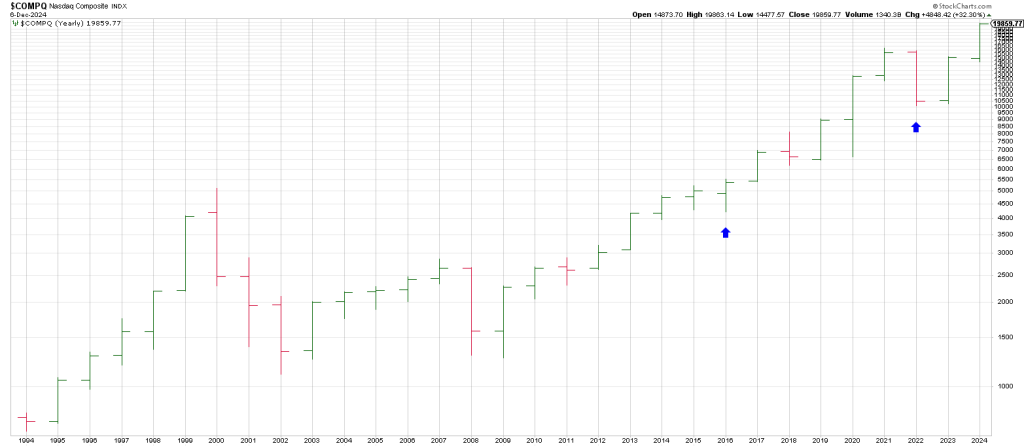
While the NAZ collapse in 2000 to 2002 mirrored the DJIA debacle from 1929 to 1932, it was a bust off a 5 year advance.
Currently the NAZ been rallying for FIFTEEN years. The last 5 years have been virtually parabolic aside from the one year turn down in 2022.
A yearly SPX shows the parabolic advance from early 2020.
The behavior of the SPX after the turndown in the yearlies in 2020 and again in 2022 speaks to the parabola in progress.
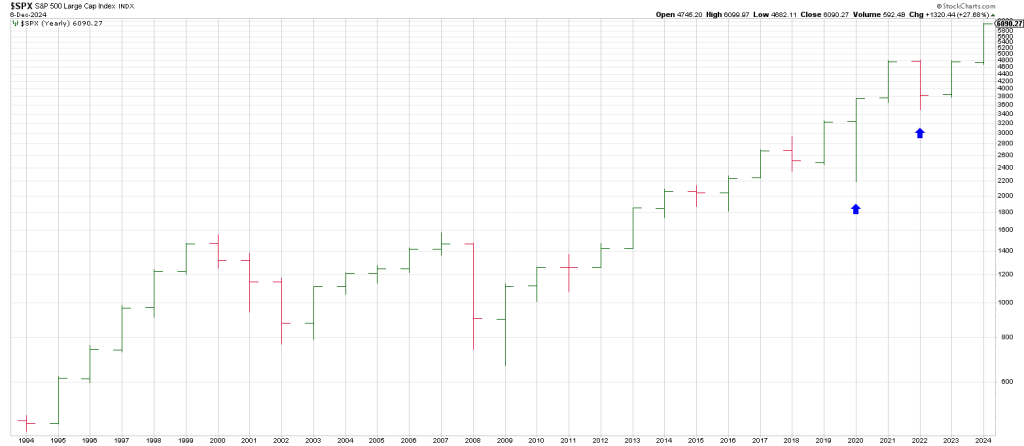
The next turndown of the yearlies will have a lot to say about The Bust.
The behavior of the Monthly Swing Chart on the next turndown will tell us whether the market will extend in 2025.
In sum, we know that the 5 year cycle from the January 2020 top led to a crash.
Before most had ever heard the word Covid, we were forecasting a crash.
The powerful 18 week rally prior to the Covid Crash, blinded the vast majority of market participants to the risk on deck at the time.
Cycles warned.
Currently the market is in a similar position. This week marks the 18th week since the early August 2024 shakeout low.
That low was 4104 SPX.
An hourly trend channel shows we are at resistance.
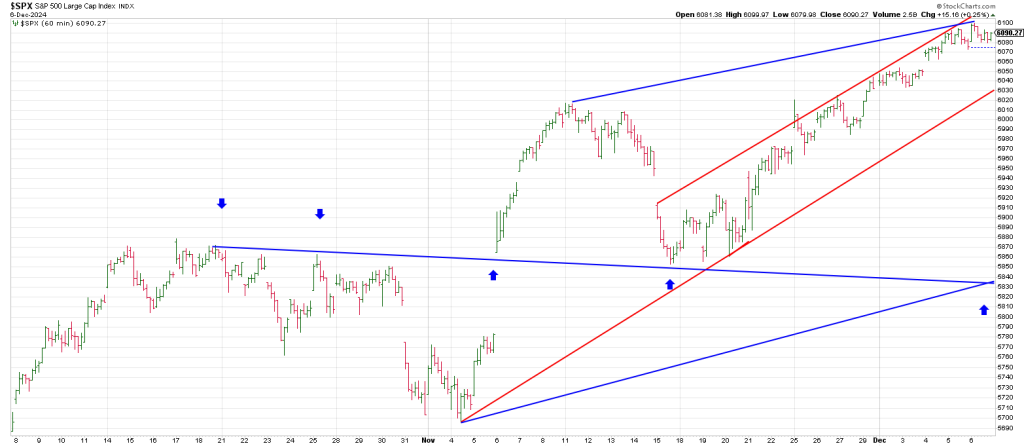
The Square of 9 Wheel underpins this region as resistance.
609 (6090) is 3 revs of 360 degrees up from 349 (3490) the October 2022 low
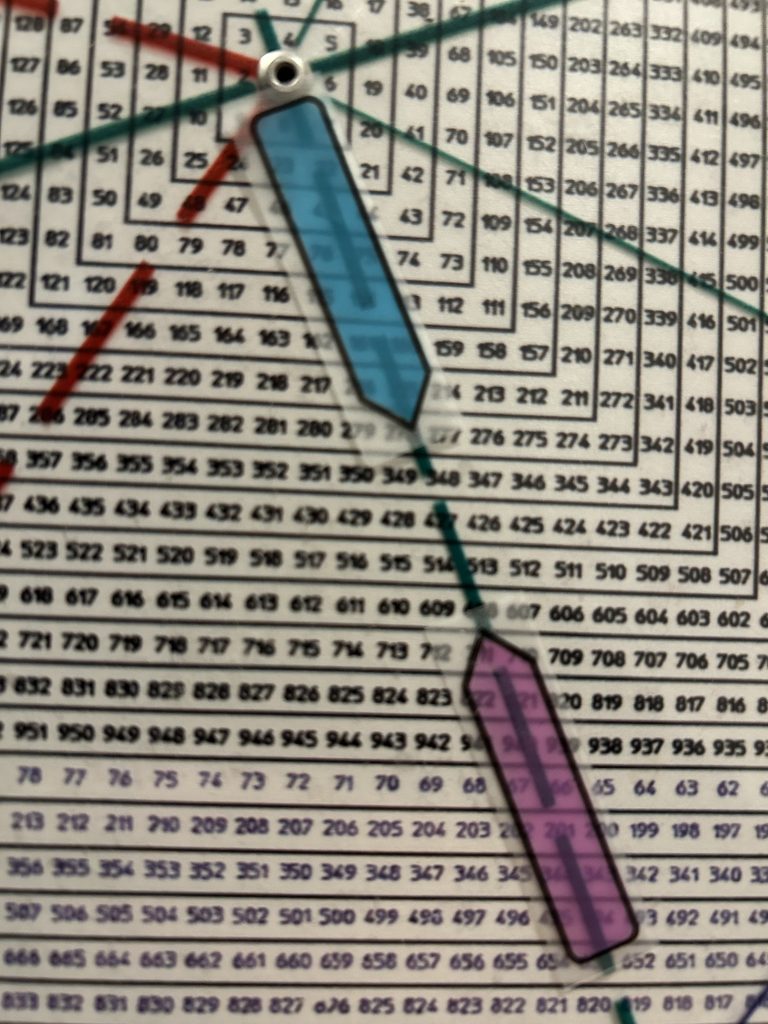
Breakage above 6090 opens the door to 6160 (616) which is opposite the 666/March 6, 2009 square-out low.
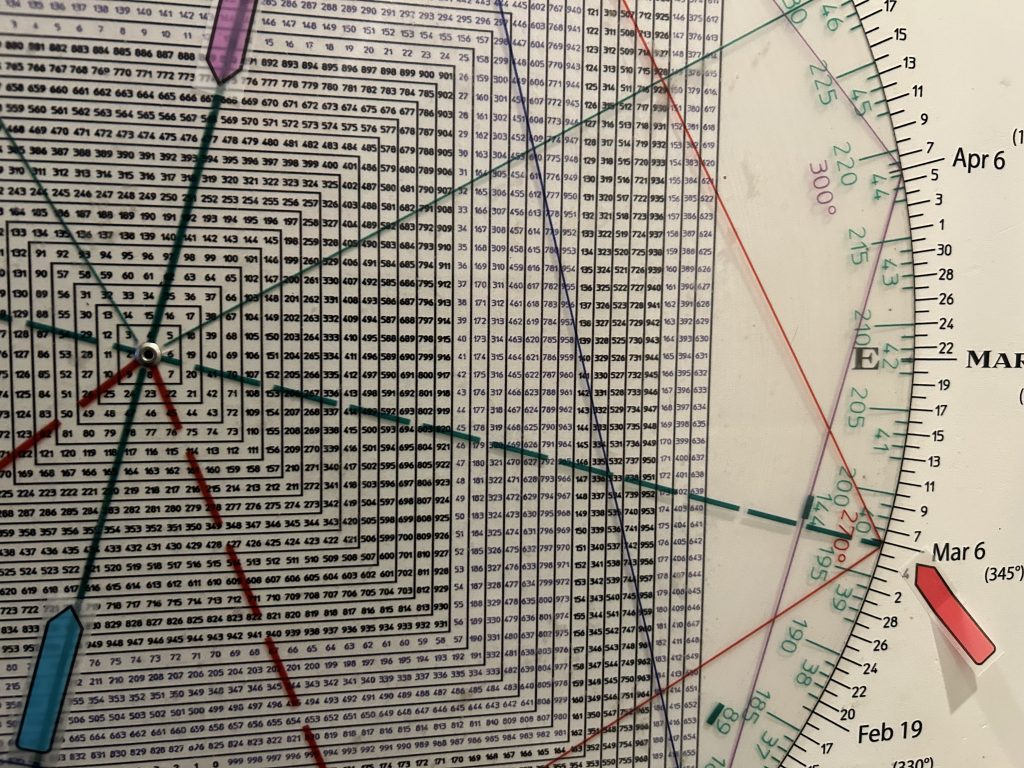
Nobody’s perfect, but the Square of 9 is as close to anything I’ve seen when it comes to calling market turns.

Square of 9 Wheel
Purchase your own Square of 9 Wheel. Shipping to US only. Contact Jeff for shipping outside the US.