“Wednesday just don’t go
Thursday goes too slow
I’ve got Friday on my mind.” Friday on My Mind, The Easybeats
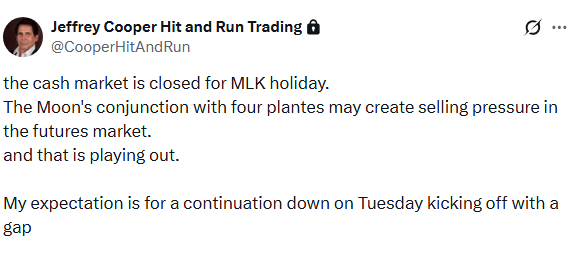
On Sunday on the Hit and Run Private Twitter Feed, we noted our outlook for a continuation of the selling for Tuesday.
A daily SPX shows the large Breakaway Gap, followed by a 3 Plot ORB.
Allow me to explain.
An ORB is an Opening Range Break—a move above or below the first half-hour’s range.
A 10 min SPX for Tuesday shows a down ORB followed by an up ORB and a Slim Jim (a narrow range sideways stint.
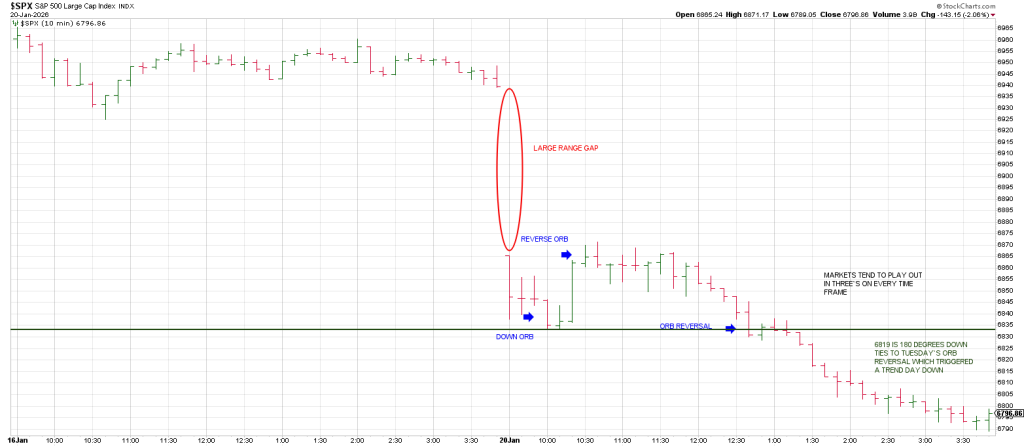
So we had a down ORB followed by Reverse ORB (an ORB to the topside reversing the down ORB.
The Reverse ORB never got any upside traction…a tell.
When the SPX broke below the morning low it triggered an ORB Reversal…a reversal of the upside ORB.
In sum, like the shifting of gears in a Lambo, the 3rd gear is the momentum move.
The break of the morning low perpetuated downside momentum into the bell.
A daily SPX shows the massive Breakaway Gap that snapped a Bottoms Line from the November 21 swing low in league with a close below the 50 day line.
As well the SPX triggered our Triangle Pendulum sell signal: it broke out of a long triangle to the topside and reversed taking out the bottom of the triangle with authority yesterday.
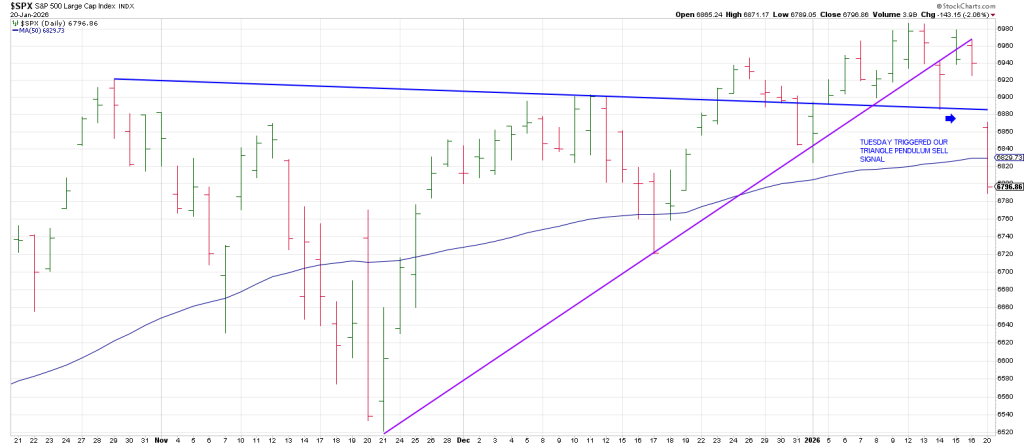
The close below 6819 opens the door for lower prices.
Here’s why.
From last weeks 6986 all-time high:
90 degrees down is 6902. That was broken on the opening gap.
180 degrees down is 6819. The SPX closed below that region as well opening the door to the next decrement of 90 degrees down (270 degrees down from high) at 6737.
That ties to the last swing low on Dec 17 at 6721.
A full 360 degree drop from the high squares-out at 6655.
A 540 degree “cube-out” projects to 6493 which ties to the important 6522 swing low on November 21.
Reversing the math, momentum from the November 21 low “called” the SPX all-time high.
I had several calls from friends and fellow traders asking me if I thought we had struck a low because we were oversold.
Without going through a whole litany of dates where we have been oversold and not turned up.
Suffice to say that we were oversold on Friday, October 16, 1987 the day before Black Monday.
Succinctly, I don’t use indicators. In my experience they are more descriptive than predictive.
I use Time, Price and Pattern to determine the trend and identify setups.
My answer was, “turn the chart upside down. you’d be wildly bullish looking for a test of the last inflection point. In this case 6500 region (which in an inverted chart represents a 300 point rally).
Checking the Square of 9 Wheel for a possible Time/Price square-out, we see that January 21 (red( squares 682 (6820, green)
We closed below 6820. As long as we remain below 6820 (except for a possible brief Pinocchio) then pressure remains down.
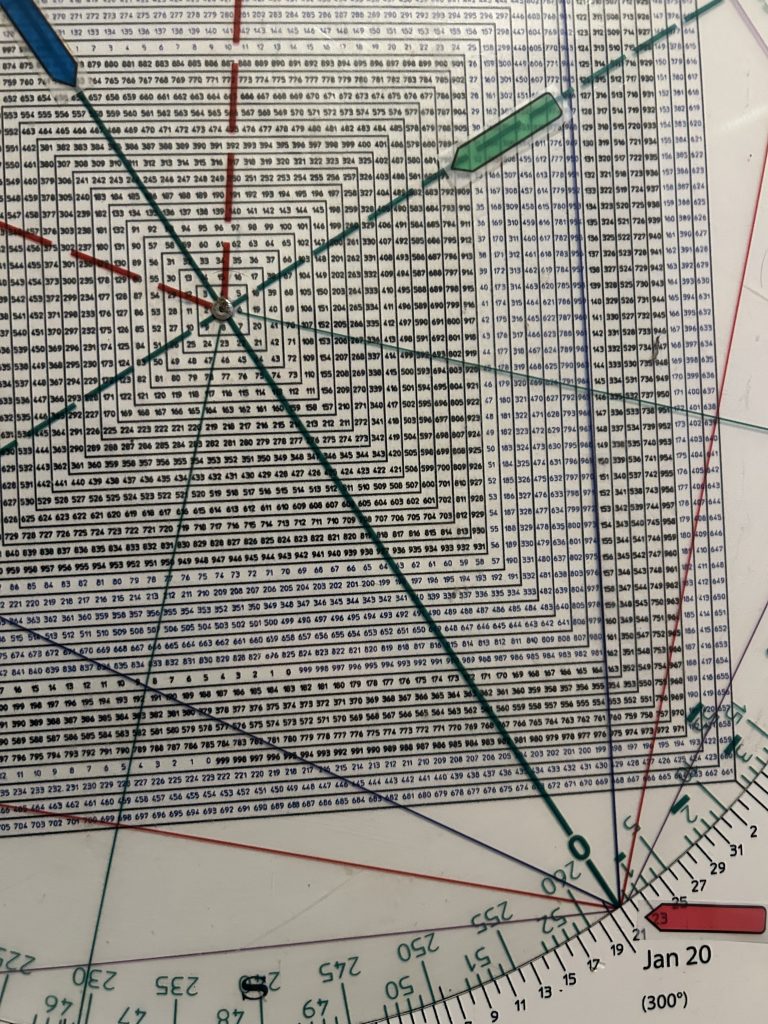
180 degrees straight across and opposite January 21st is 656 (6560 blue).
Is the takeaway that the SPX is on a trajectory to the 6560 region this week?
Above we noted that 6493 is 540 degrees down from the all-time high.
To fall 540 degrees in one week would look like a Flash Crash, but in reality it’s not even a 10% drop off the high. But it’s the speed at which it could be satisfied that would feel like a Flash Crash.
Tuesday’s breakage below the SPX 50 day moving average is a point of recognition prior to waterfall moves.
Let’s look at a famous example…Black Monday from 1987.
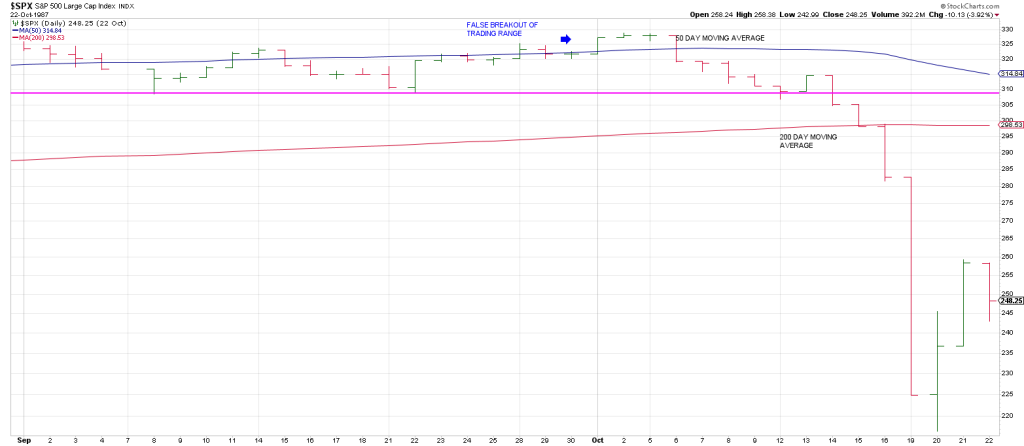
The downside moment started—not ended—with a knife below the 50 day moving average.
Interestingly, not one of the 10 days going into Black Monday saw a gap down as if there was no urgent selling—keeping the bulls in the barn while Molotov Cocktails were lobbed in.
I don’t think a crash is on the table from here, but you never know. There time factors in place.
On Friday January 9, the SPX broke out to a record high. It struck a record high on Monday Jan 12.
This is the anniversary of the January 11 all time false breakout in 1973.
It was followed by a 50% sell-off.
That does not mean this is January 1973, but if the next rally attempt is corrective (3 waves) versus impulsive and then we make a new low, there is a strong likelihood that an important high is on the table.
That said, on November 20, the SPX carved out an LROD or Lightning Rod—a large range outside down day that knifed through the 50 day line closing well below it.
It looked like a test of the 200 dma was a cinch.
However the urgent selling dried up overnight.
Could Tuesday’s Urgent Selling characterized by a Breakaway Gap below the 50 DMA stop in its tracks as well?
There are several arguments against that outcome:
1) The index broke out prior to this decline setting up yesterday’s Trap Door.
Fast moves come from false moves and Tuesday was only Day 1.
2) The SPX obliterated a Bottoms Line from the November low. In truth this is the same trend line that originates from the April 7 low.
3) The first mouse got the squeeze and the odds are this is the second mouse that will get the cheese for the bears. In other words there was no follow through after the November 20 knife below the 50 day line and when it was reclaimed we got a Squeeze Play to new all-time highs. This second mouse below the 50 dma is likely to get the cheese for the bears—at least in the near term.
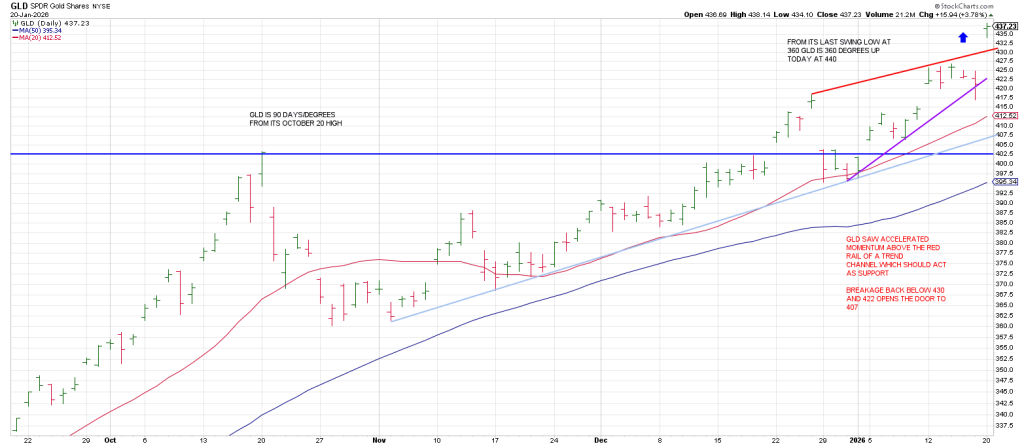
It will be important to see the action and structure into late January as that is 90 days/degrees from the October 28 Primary High.
If selling pressure is still weighing on the market after late January, then the next important time period to watch is the one year cycle from the Feb 19, 2025 peak.
February 19 is also the pre-Covid Crash peak in 2020.
These two anniversary dates could ellict a turning point.
If the SPX has dropped 360 degrees or 540 degrees into February 19th and holding above its 6147 February 2025 high it may translate into a High To High to Low Cycle:
2020…2025….2026.
Below is a weekly SPX from the 2022 peak with a parallel channel that nailed the October 2025 high, underpinning the idea that last weeks high was a Secondary High.

In sum, an hourly SPX from the April low shows the clear cut failure below trend.
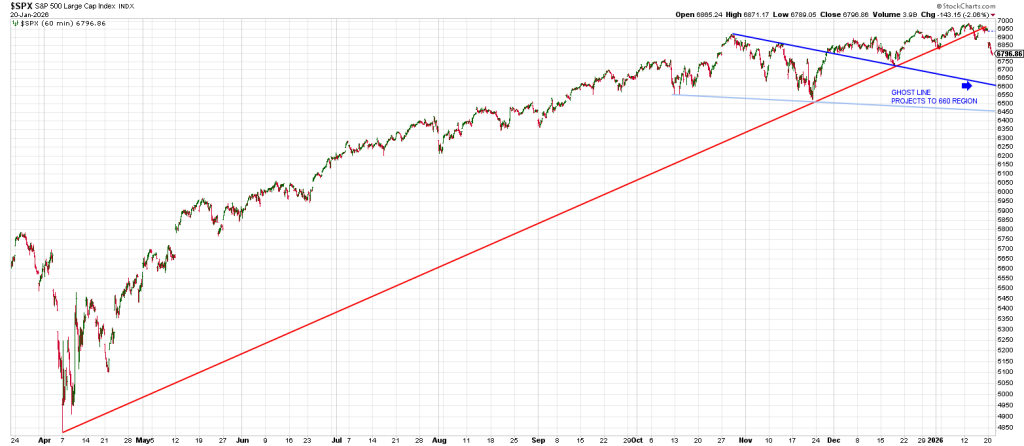
The dark blue Ghost Line ties to 6600.
Light blue is a Bottoms Line that aligns with 6450.
From my perspective, the SPX is on a trajectory to the 6450 to 6600 region.

Square of 9 Wheel
Purchase your own Square of 9 Wheel. Shipping to US only. Contact Jeff for shipping outside the US.
Grab a free ebook about the amazing Sq of 9 Time/Price Calculator at
Cooperhitandruntrading.com