“All moments, past, present and future, always have existed, always will exist.” Kurt Vonnegut, Slaughterhouse Five
“You know you drive me up the wall
The way you make good on all the nasty tricks you pull.” Crazy, Aerosmith
On March 23rd, 2020, the day of the Covid Crash low we forecast a new advance that would carry the SPX to over 4000 within a year.
One of the factors that gave me the confidence to make that forecast was that March 2020 was the first time the SPX struck the bottom of a trend channel from the 2009 low.
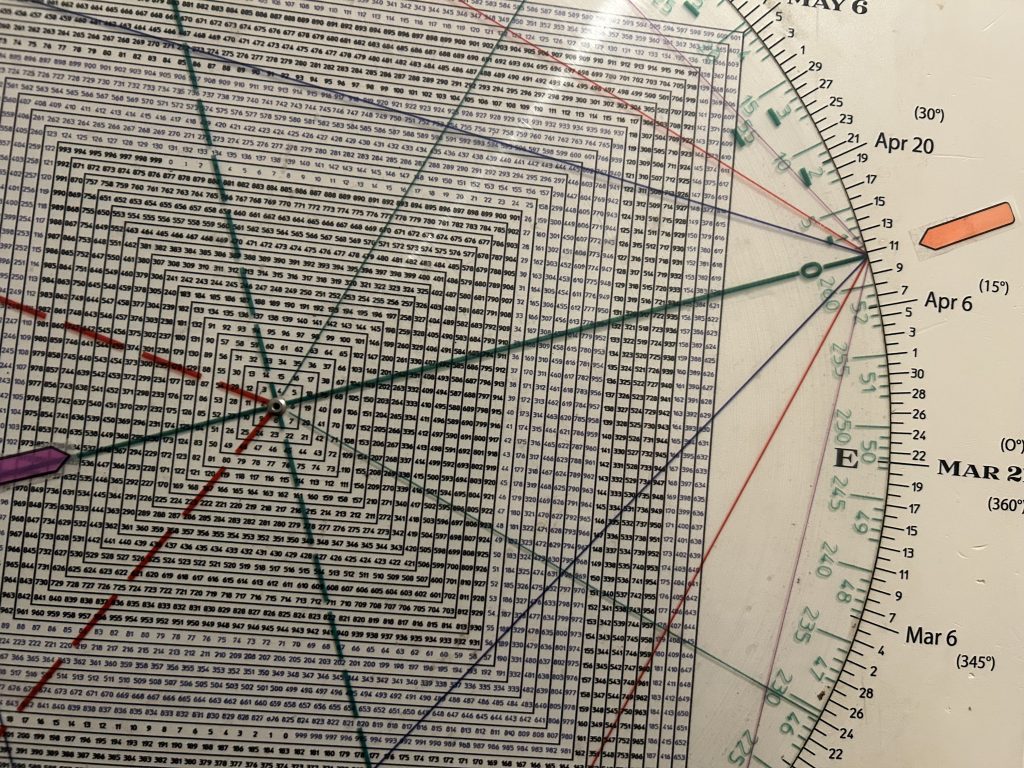
In fact, March 23rd, the low day, squared-out with the SPX pre-crash price high.
But this is not about why March 23 set up as a low but why we thought the bull would rage on after falling off a pandemic cliff.
Technical analysis is an amazing tool to be able to indicate an advance out of the abyss nearly 20% above where the market was when the pandemic put a stake in its heart.
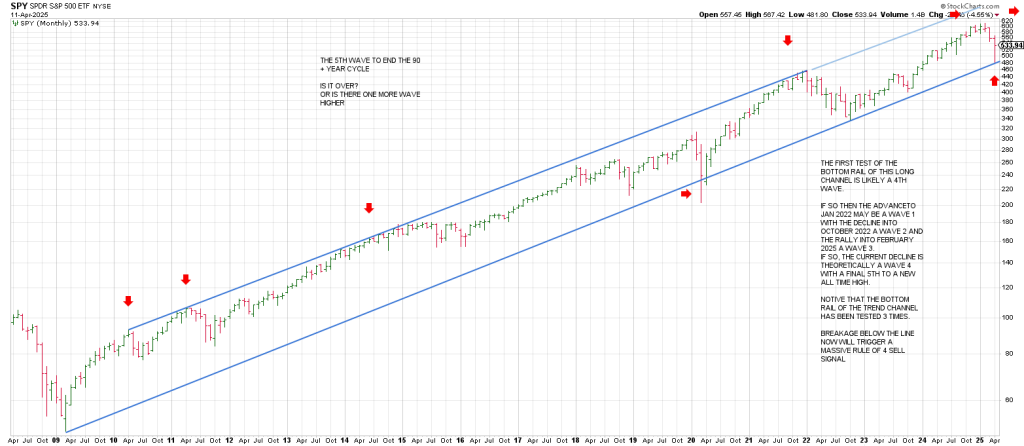
First let’s look at how I produced the trend channel.
I started from the first two peaks after the low and connected those to the series of highs in 2015-2015,
That created a 3 point trend line.
Next I paralleled a line off the March 2009 low.
The March 2020 low undercut the bottom of the channel but notably the SPX never closed below this monthly trend channel.
My presumption was the SPX would drive to the top of the channel. Why?
Because the long advance into 2015 could only be a Wave 3.
That meant that the March 2020 low was an Wave 4 low.
Too short compared to Wave 3.
Not at all.
The March 2020 low was the C wave of an A B C Wave 4 correction.
Wave A down was the drop into December 2018.
Wave B up was the rally into Jan/Feb 2020.
The Covid Crash was Wave C.
Consistent with the idea that Wave C’s are vicious crashes.
But they are also capitulations and crescendos.
That means that the January 2022 high was a Wave 5 top of some degree
OR
It was Wave 1 of a Final Fifth with the October 2022 low a Wave 2 of a Final Fitch
And the top in January/February a Wave 2 high of a Final Fifth with
The current decline being a Wave 4 bottom.
But this is to be determined.
It is conjecture.
The main thing is that the October 2022 low was the 3rd point on the bottom of the trend channel
The current decline tested The Line and has rallied.
Great. The coast is clear, right?
Not so fast. The T Rex in the ointment is that you don’t typically see quadruple bottoms. The 4th time thru is usually the real deal
I’m not saying it’s impossible for this to be a successful 4th point on the trend channel, but the odds are against it.
The odds favor a Rule of 4 Sell.
That said, we must be mindful that the market can do anything.
And the bigger the top, the bigger the hook.
The last thing one wants to do at this juncture is turn their back on a wounded bull like a grandiose Matador.
Some have not lived to tell the tale.
To recap, the first test of the bottom rail of this long channel is likely a 4th Wave because the Long Wave preceding it is consistent with a powerful Wave 3.
Remember the bottom rail is paralleled off the top rail and was in place before the March 2020 debacle.
Let’s go along with the presumption then that the advance to January 2022 is a Wave 1 of a Final Fifth with the decline into October 2022 a Wave 2 of 5.
That implies that the February 2025 peak was the top of a Wave 3 of 5.
Clearly the persistency and scope of the advance from October 2022 is consistent with a Wave 3 of some degree.
The bottom line is that the downdraft from the February high to the bottom line of the trend channel may theoretically be a Wave 4 of 5.
IF and it’s a big IF, this is true, then Slaughterhouse 5 is in front of us.
I say Slaughterhouse 5 because it will chew up the conviction of both bears and bulls alike.
I would destroy bulls whose conviction has been thrown into disarray and it would destroy bears who have been given something to crow about…rightfully so.
It’s not just that the market has corrected, it’s that it’s hyperventilating: the volatility is savage, inhuman.
Perhaps that is the point…the machines are whipping the bejesus out of market participants.
Volatility precedes price. This intense volatility of late implies the next direction in price will be intense.
The overarching question is whether the intense directional move will be up or down.
As such this week is the most important week since this year’s high.
As such this week may prove to be one of the most important weeks of the year.
Because whatever way the SPX comes out of this position is going to be stunning from my perspective.
It could stun to the downside and theoretically to the upside.
Allow me to explain.
1)This week is the end of the Gann Panic Window counting from the Feb 19 ATH.
That does not mean this decline’s first leg can’t go 90 days/degrees into mid-May which interestingly is the Secondary High in 2008 and the anniversary of the NYSE, May 17, 1792.
Could that be a pivot high as well? Yes.
2) the SPX satisfied our forecast for a drop to the scene of the crime…the 5100 SPX August 2024 low where a blow-off started.
3) Our outlook was breakage below 5100 opens the door to a test of the prior high…the 4818 January 2022 bull market high.
We got to 4835.
4) the SPX rallied to 50% of the entire range of the year last week.
The range from the 6147 peak to the 4835 low is 1312 points.
Half that range is 656 points.
656 added to the 4835 low gives 5491.
Wednesday’s rally (albeit suspect based on a game of White House red light, green light) hit 5481.
The SPX dropped 364 points intraday the next session to 5117 before rebounding to close at 5268.
You can’t say the market doesn’t know this 5490 region.
Interestingly Wednesday’s high satisfied a daily Minus One/Plus Two Sell setup when it should have been easy to turn the 3 Day Chart up on trade above Wednesday’s high on Thursday given Wednesday closed near the high of the day.
Despite Thursday’s plunge off the 50% retrace which is the normal expectation the first time up, Friday the SPX respected the Roadmap’s projection for an 11:30 pivot low ripping 138 points in a few hours.
Amazing.
Almost as amazing as the Sq of 9 April 11 square-out at 537.
Friday’s SPY rally hit 546.43.
Sunday we got more red light, green light.
After Friday’s close there was an announcement that there were going to be exemptions for China on certain electronics, phones, and chips.
Sunday Trump signaled the exclusions on tech will be short-lived.
Yes we have no exemptions, we have no exemptions for you.
This reminds me of Jerry Lewis driving Mrs. Wellonmellon’s Cadillac in The Errand Boy.
Gas, brake, gas, brake, gas, brake
5) Lastly, a weekly SPX shows potentially bullish Train Tracks.
Follow thru coming out of this week will be key.
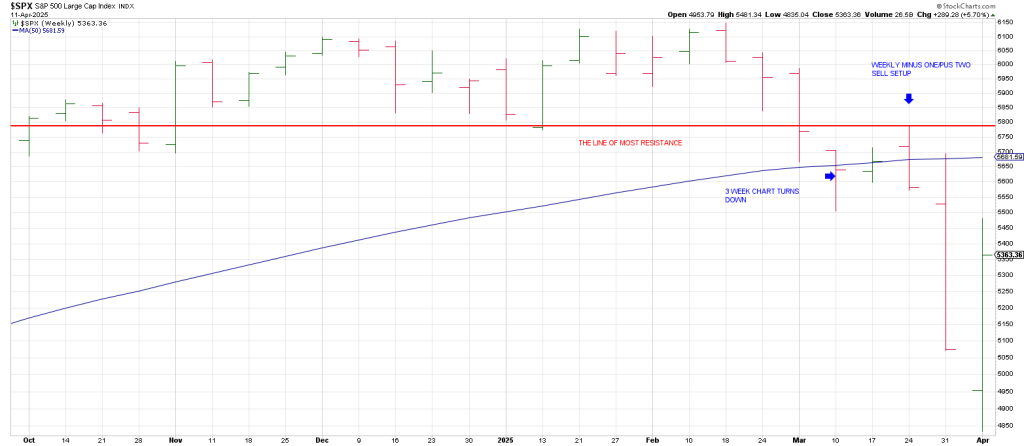
Notice the overhead 50 week moving average ties to the key summer high.
So even if the SPX is able to reclaim a 50% retrace and 5500 it has the resistance at the 50 week ma to contend with..
The 50 week moving average also ties to the where the SPX carved out a weekly Minus One/Plus Two sell signal.
Drilling down to a daily SPX depicts the 5650 summer highs (horizontal red line).
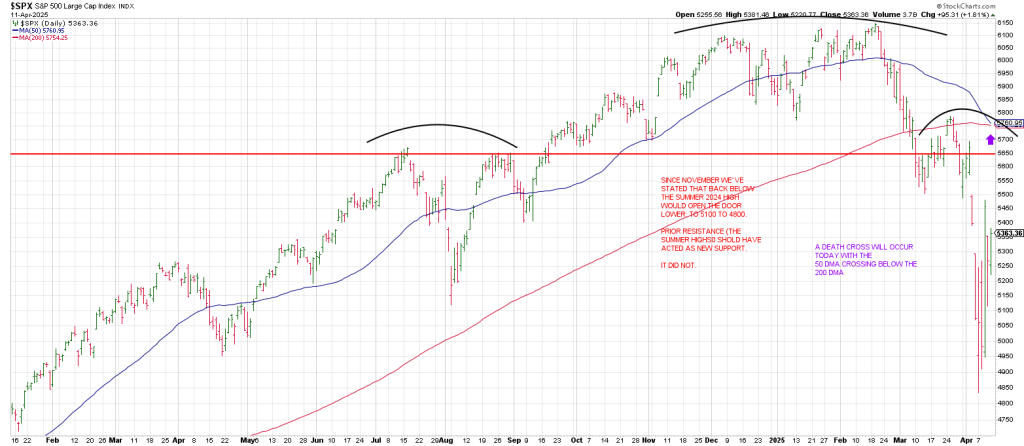
A push above the 5500 mid-point to 5650 may not be the all-clear that some market participants may perceive it to me.
It ties to a test of a Death Cross which will occur today.
This is where the 50 day moving average crosses below the 200 day moving average.
This “cross” level may define the Right Shoulder of a 9 month Head and Shoulders top pattern.
Notice how the potential Left Shoulder is a double top.
A drive to the 5700 region again may be a symmetrical double top in the context of a Right Shoulder.
In sum, if that is correct, it carves out a Neck Line in the 4850 to 4950 region giving a projection on a break of 4800 to 3550 ish.
In other words a failure below the 4800 January 2022 peak opens the door to 3500…the October 2022 bottom.
The symmetry of the structure is compelling.
Be that as it may one of the most important trading lessons I have learned is that after a big downdraft, reclaiming the mid-point suggests it was a ‘flush-out’, a shakeout and that a test of the old highs or new highs.
If that happens…the FOMO will be King at the top of Slaughterhouse 5.
Tomorrow’s report will look at the SPY to determine what level that could target.