The two biggest lows in the SPX since the January 2022 top were October 2022 and October 2023.
Connecting those trendlines ties to the August 2024 low this month
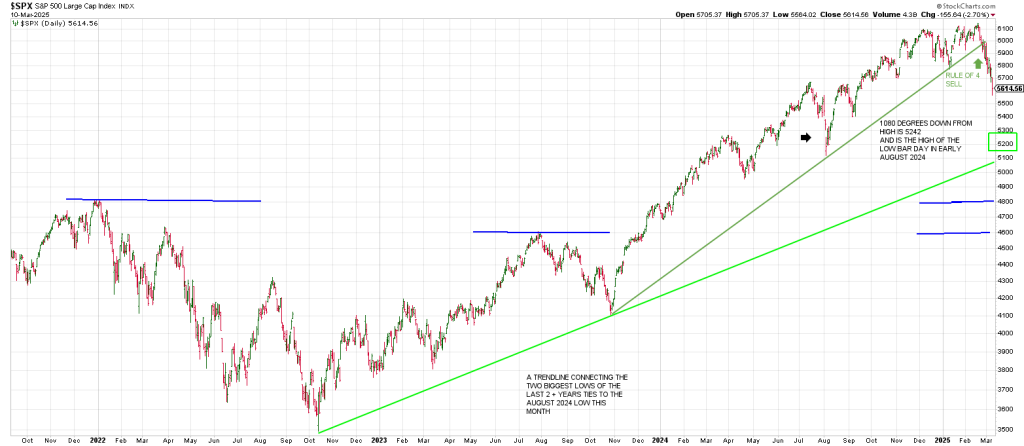
As well we know that 5685 is a cube-out of the all-time high.
Given the angle of attack to the downside knifing below 5685 right off an all time high, the presumption is the SPX is targeting another full cube down which is 5242.
5250 is the high of the low bar day on the important August 5th low.
Half way between the all-time high and 5250 is 5698.50.
That ties to Monday’s gap down open of 5705 which was Monday’s high…as correctly forecast by the Roadmap.
It looks like this 5705 region is the upside pivot. It’s approximately 90 points above Monday’s close.
My expectation was for a rally today and we bought calls.
Whether or not the SPX can push to 5705 remains to be seen.
However, 572 on the Square of 9 Wheel square-out with February 19th, the day the SPX reached its highest point in history.
Pressure should remain down as long as the SPX remains below the low 5700 region.
Checking the above daily SPX also shows that the accelerated decline starting in late Feb was triggered by an Angular Rule of 4 Sell…a break of an rising 3 point trend line from the October 2023 low.
Amazing.
This week March 12/13 looks important:
On September 11 the SPX impulse up from the first pullback low following the big August 5th low.
90 days/degrees later is mid-December which was a peak.
Another 90 degrees out or 180 degrees from the September 11th ish impulse is this week.
That said the Gann Panic Window remains open until March 17th or so.
The “or so” is important because + or – a few days at the tail end of the Gann Panic Window can make a big difference in your account.
To wit, Black Monday 1987, was 1 trading day after the Panic Window closed (3 calendar days).
Caveat Emptor.
We want to observe what the market does going into the Spring Equinox, Gann’s “Zero Point”, the natural beginning of the year.
We know that March 24th was the all-time high of the Bubble Top in 2000.
That was 5 squared years ago, 25 years.
We know that March 23rd was Covid Crash low in 2020, on the important 5 year cycle.
So it will be important to observe the message of the market in this time frame.
A drop down to the 5100-5200 region that ‘sticks’ will theoretically install the third point of a 3 point trend line from the October 2022 low.
I would expect that to define a low of some degree if we get there.
If so, the presumption is it perpetuates a counter-trend rally.
The blue horizontal band on the far right is ties to a level where the SPX should target.
It is the January 2022 high of 4800 ish and the July 2023 peak of 4600 ish.
4700 is the midpoint.
Remarkably THREE cubes down from the all time high is 4816,
This is 1620 degrees. Can you say Fibonacci.
Markets play out in threes.
Once the important 2022 top was cleared with momentum, one could have deduced that if a blow off into the important cycle due to hit in 2025 was on the table you could have done the math and noted that THREE cubes up from the 4818 high in January 2022 is 6147.
Amazing.
Do markets play out in THREE’s?
Is January 2025 three years from January 2022?
Was Jonah in the belly of the whale for 3 days and 3 nights as Gann writes on page 69 of his novel, Tunnel Thru The Air?
3 6 9 as Nikola Tesla stated, the secret to the universe.
There are only two ways to increase, to progress.
Addition . 3 +3=6
Or
Multiplication 3 X 3 = 9
“My calculations are based o n the cycle theory and on mathematical sequences.
Mathematical science is the only real science that the entire civilized world has agreed upon, furnishes unmistakable proof of history repeating itself and shows that the cycle theory or harmonic analysis is the only thing that we can rely upon to ascertain the future.” W D Gann
A daily QQQ from the October 2022 bottom shows a mid-channel line at 450 ish.
Breakage below 450 theoretically opens the door to 360.
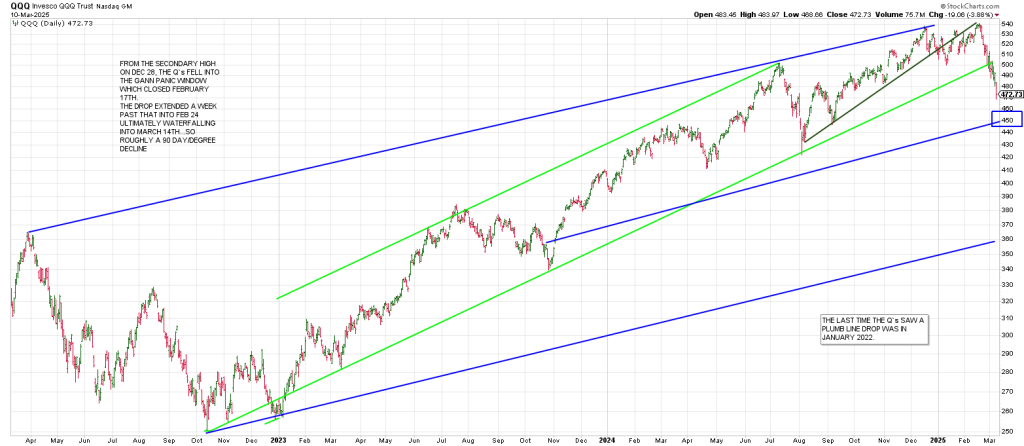
Tomorrow’s report will walk thru the squares in the Q’s
You should print out this chart as a template.
If we get a strong countertrend rally presumably after the Gann Panic Window closes,
Then you can see that a backtest of the broken green channel should be staunch resistance at 500.
Below is a daily TSLA.
It’s done a round trip.
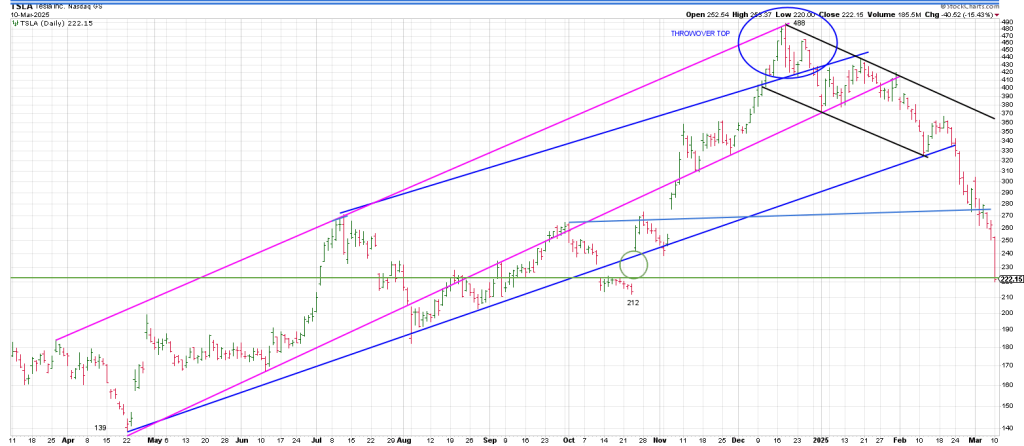
Notice the waterfall following breakage of the bottom of the blue trend channel.
No voodoo, just simple trend lines.
204 is the high of the low bar day on August 5th.
199 is 4 squares of 360 degrees down from the all-time high of 488 on December 18.
Said another way TSLA drove up 4 revs of 360 degrees from the August low.
March 18 is 90 days degrees from the December 18 large range Key Reversal Day.
It’s true what they say, “range precedes price”.
The action in TSLA next week especially if it has satisfied a test of the 200 region should be a good tell on the market.
TSLA isn’t the only iconic tech darling to cause bleeding of the billionaires in 2025.
But after AAPL, it’s THE Iconic Darling.
The waterfall decline has silenced the Lambo’s