“There’s a hole in the ground into which I’m falling
So godspeed to the sound of the pounding.” The Shock of the Lightning (Oasis)
This morning’s report will be brief and to the point.
Because The Cycle and The Setup have been playing out.
We will see if they continue to speak.
This is where the bulls must make a stand. If they are going to.
Allow me to explain.
For the last 6 months we have pointed out the synchronicity between 2025 and 1929.
According to the Gann Panic Zone, we are in potential waterfall territory this week and next and we saw a colossal Turnaround Tuesday—from up 200 on the SPX to down as much as 150 before a late rally trimmed losses.
Below is a daily DJIA of the 1929 crash.
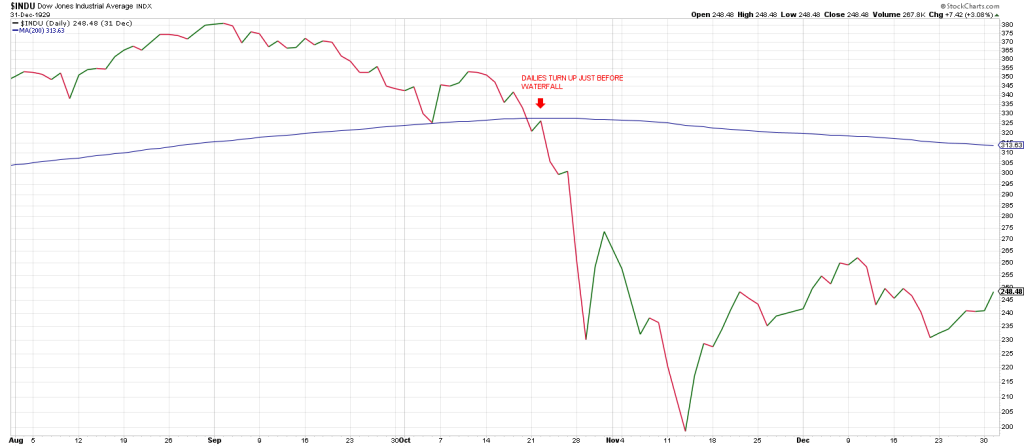
On October 21st the DJIA opened the down door.
It gapped below its 200 day moving average breaking its prior low for the move from October 4th.
The October 4th low was a vital test of the 200 DMA which produced a 5 day rally.
October 21st was the 48th calendar day from the September 3 peak.
On October 22 the DJIA turned its dailies up and petered out closing back below its 200 day moving average.
That was the 49th calendar day from the high.
The 49th day from a high is the heart of the Gann Panic Zone.
W D Gann stated that 7 is the number of Panic.
7 squared is the cusp of panic.
If panic is going to erupt it does so in the 7th to 8th week from high.
On Oct 23, 1929 , day 50, the wheels started coming off as the DJIA broke with authority below its 200 dma.
Oct 24th, Black Thursday, day 51, saw accelerated momentum, but tailed up to close above the mid-point of the day perpetuating a consolidation day on Friday, October 25. Day 52.
Monday, October 28th, day 55, was Black Monday. The DJIA dropped 13%.
Tuesday, October 29th was Black Tuesday, day 56.. The DJIA dropped 12%
Below is a daily SPX for 2025.
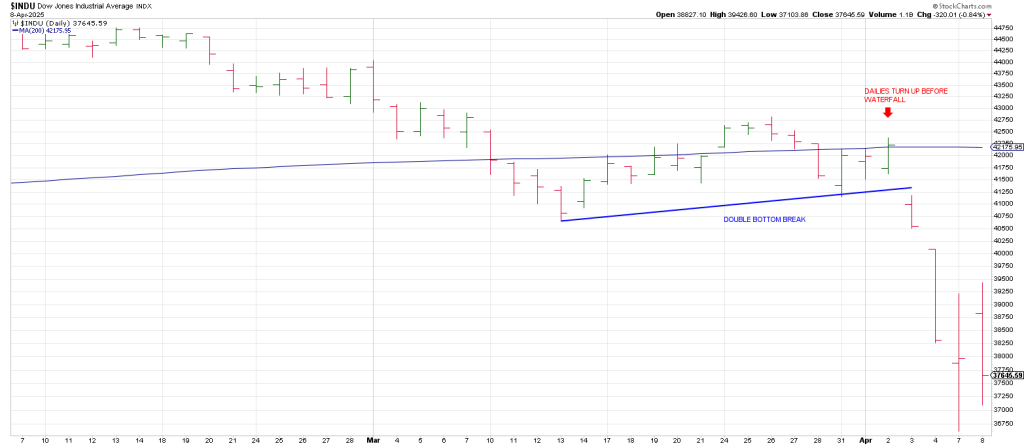
Day 43 from high was April 3rd..
The SPX gapped down below a little double bottom.
This similar to day 48 in 1929.
The SPX is ahead of schedule compared to 1929.
It is weaker theoretically.
The pattern of the little ‘double bottom’ is playing out BELOW the 200 dma in 2025 for example
In 1929 the little double bottoms occurred AT the 200 dma support.
Day 44 was Friday April 4th, the SPX collapsed following a massive gap down.
Calendar day 47 was Monday, April 7th. Another massive gap down but the index tailed up closing above its mid-point of the day…similar to October 24th, 1929
Tuesday April 8th was calendar day 48.
Today April 9th is calendar day 48.
Day 49 was the cusp of the crescendo in 1929.
Again as you can see, the analogue rhymes but we are ahead of time and water-falling earlier here in 2025.
That’s a scary thought.
Theoretically if The Cycle and The Setup continue, the next 7 calendar days warrant extreme caution.
But everyone I speak to that are not traders asks me “when do I buy?, it always comes back.”
Maybe they are not panicking because they don’t watch the market on an hour to hour basis and don’t see how unhinged and truly vicious it is.
For example in 1987 there was one shockwave and it was over.
This month we’ve had shockwave after shockwave and they are happening intraday.
Look at fury of the tape depicted on a 10 min SPX for the last 2 days.
It’s pure terror but you don’t get that sense watching the main stream media.
Maybe because 16 years of Buy The Dip has disabused market participants and commentators of the quaint notion of risk.
Sometimes risk is just risk and can’t be hedged.
Perhaps that’s the lesson of Mr. Market’s Shock Wave.
Where can a genuine crash take the market…as if it hasn’t already crashed…we have just seen the worst 4 days since the 2008 debacle.
A Square of 9 shows that from the 1929 peak the DJIA collapsed three full revs of 360 degrees to 195.
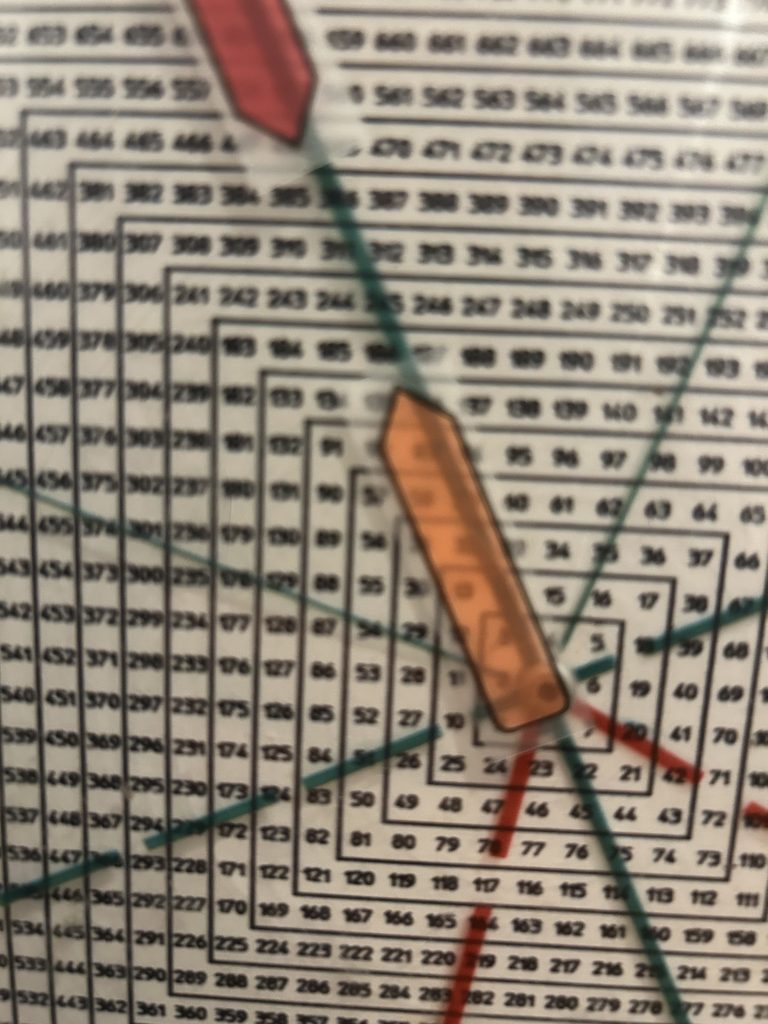
Using the SPY to compare, from the Feb 19, 2025 top of 613, three full revs down is 352.
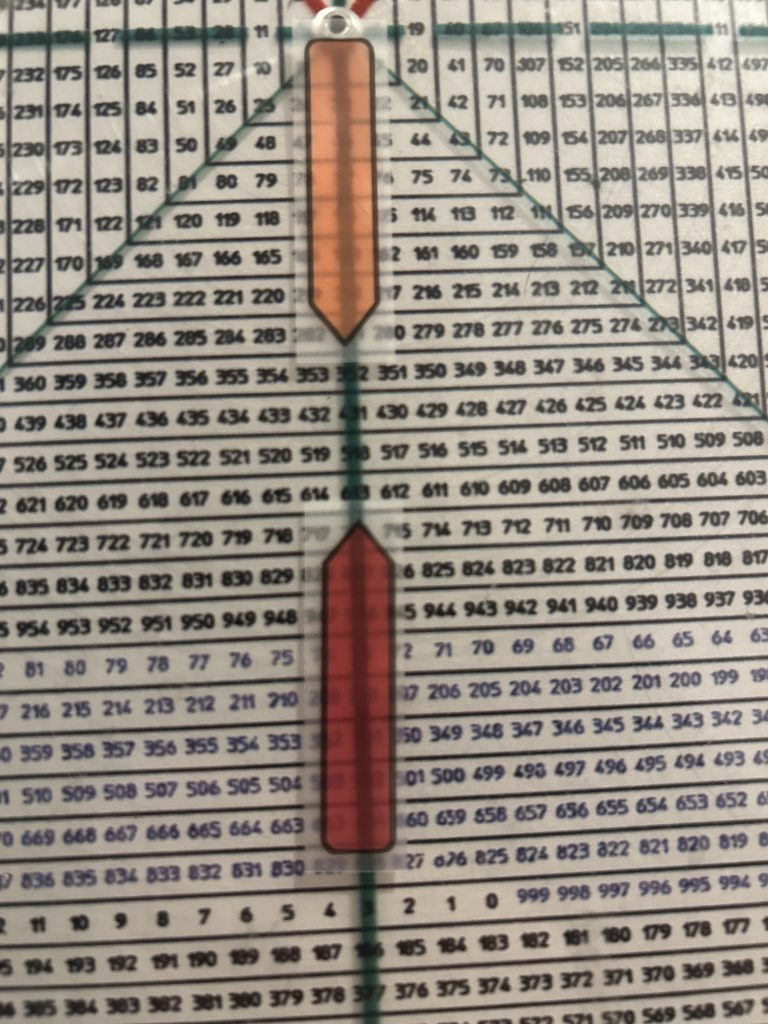
There’s some good symmetry with that region.
The October 2022 low is 348. The closing low then was 357.
It is logical that a ferocious bear would unwind the last bull market, returning to where it started.
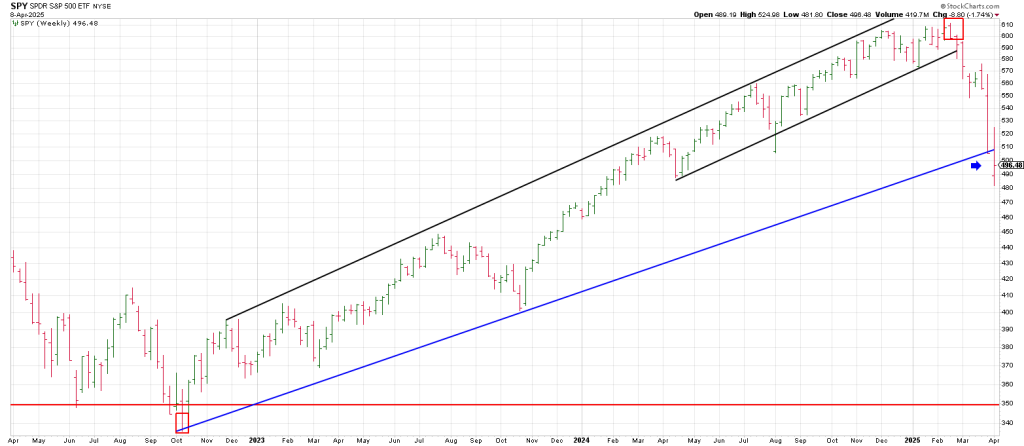
A weekly SPX shows the breakage of trend from the 2020 low (black) and the 2022 low (purple) with the index testing the prior 4800 top from January 2022.
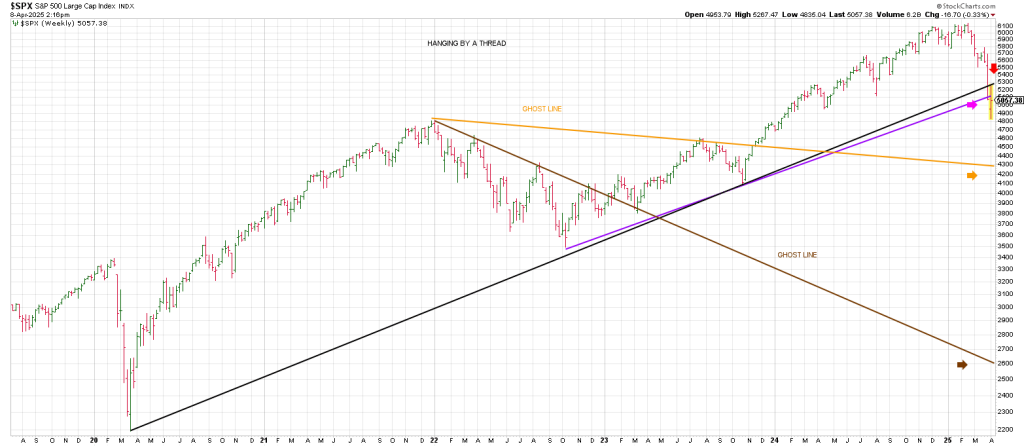
When prior resistance (4800) fails to act as new support the item is in a vulnerable position.
Below 4800 the door is open to 4300, defined by a Ghost Line connecting the Jan 2022 high with the July 2023 high (orange).
A Ghost Line connecting the lower highs throughout 2022 (brown)point to the mid 2000’s and the region of the Covid Crash low.