“The night is full of holes
Cause bullets rip the sky of ink with gold” Vertigo, U2
The two largest market cap stocks currently are NVDA and MSFT.
As of July 9, 2025, NVDA had a market cap of $4 trillion and MSFT had a market cap of $3.7 trillion.
These are the two 5 star generals that telegraph the battlefield. Sometime the troops follow sometimes the troops run for cover.
Sometimes the 5 star generals spearhead the winning battle.
Sometimes they are just trying to hold the fort down.
Translation: they are beneficiaries of scared money hiding out because of their liquidity.
Let’s take a look at the big picture in NVDA and MSFT.
While NVDA bulls are celebrating, the weeklies show what may be a Megaphone Top.
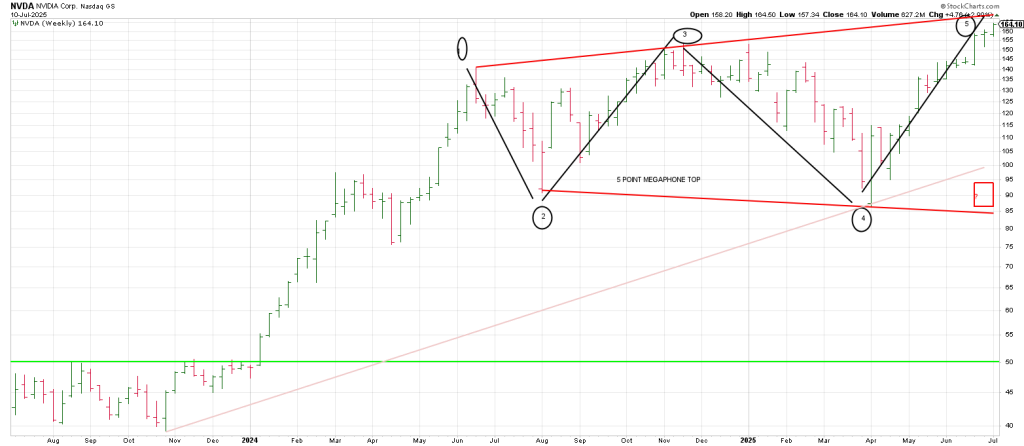
Interestingly if the Megaphone Top is confirmed it projects to the 85 region while a Bottoms Line from the October 2023 low ties to 100.
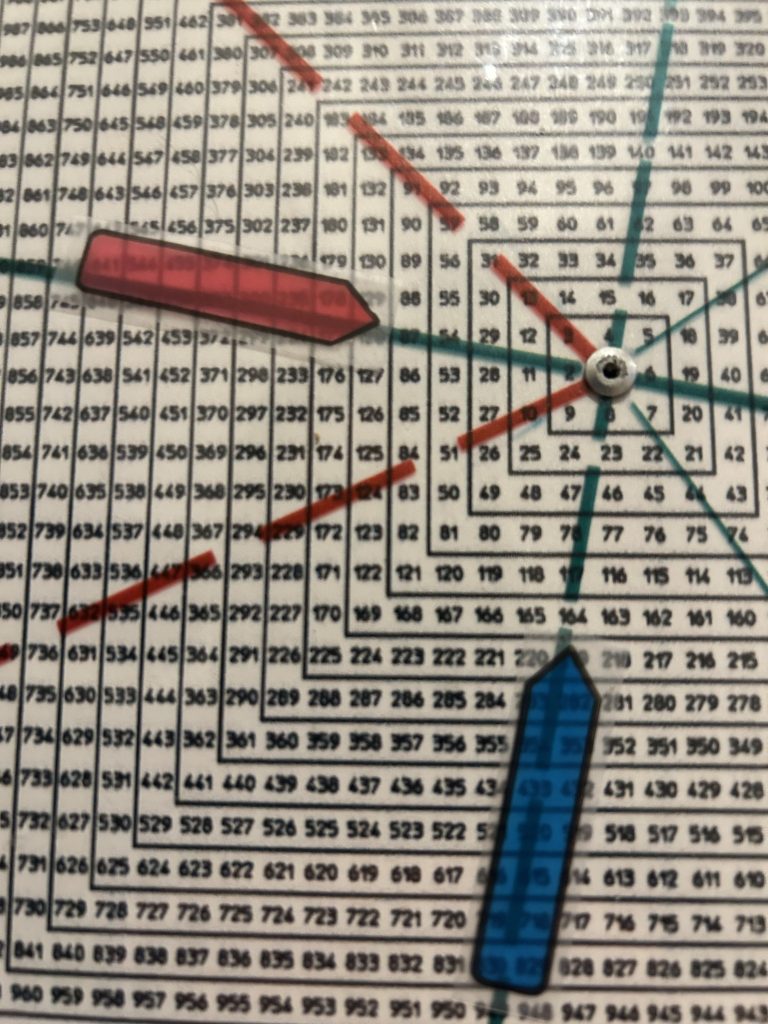
The Sq of 9 Wheel shows that NVDA’s 87 April low squares-out with Thursday’s 164 high.
MSFT was underperforming since mid-2024.
After breakage thru support in Feb 2025 it triggered a Triangle Pendulum buy signal on trade back thru the top of the triangle.
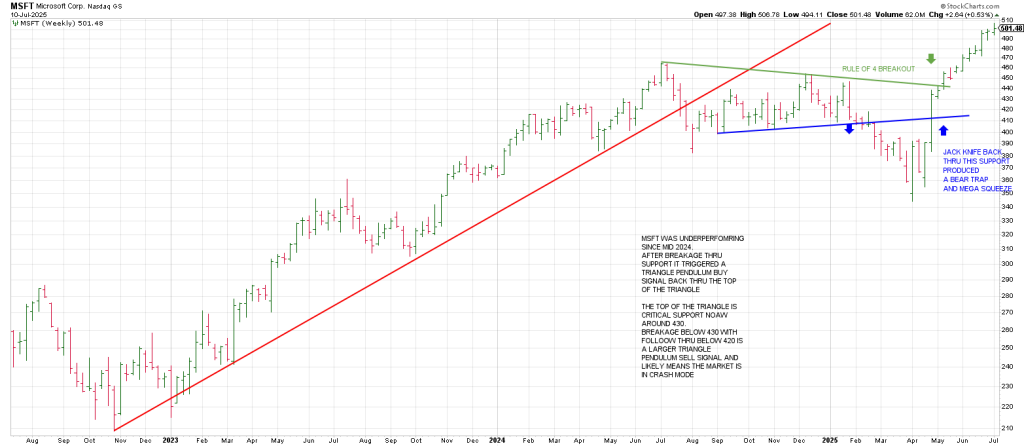
The top of the triangle which currently ties to around 430 is critical support.
Breakage below 430 with follow thru below 420 is a larger Triangle Pendulum sell signal and likely means the market is in crash mode.
In sum the Jack Knife back up thru the broken support produced a Bear Trap and a mega squeeze.
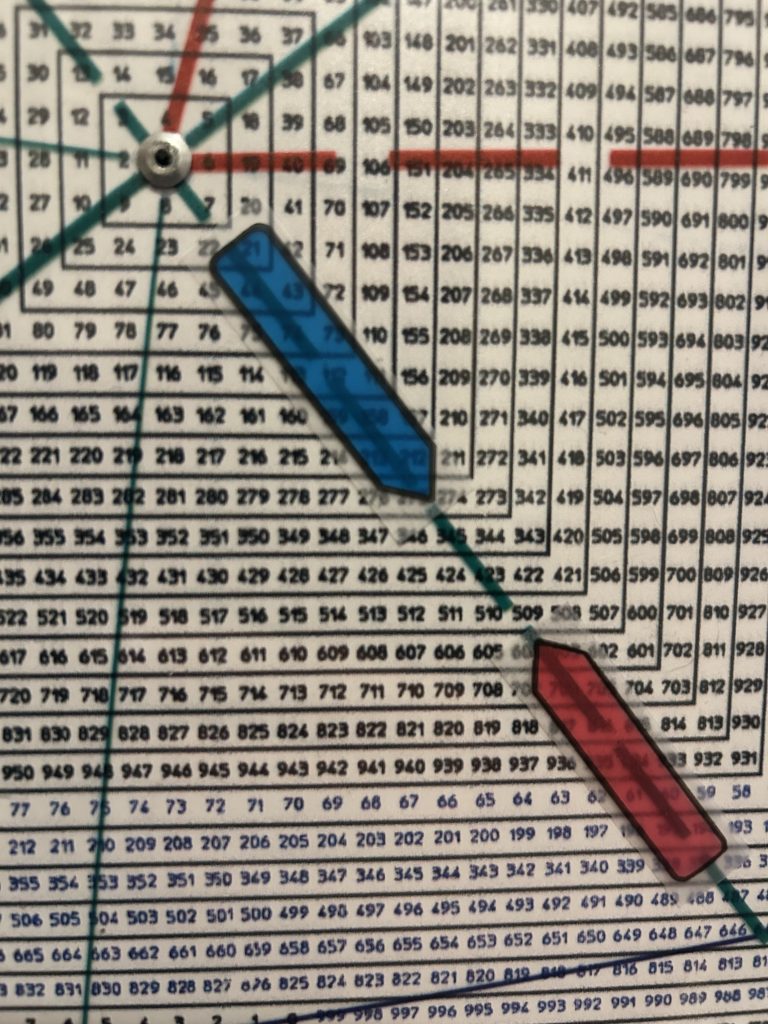
The Sq of 9 Wheel shows that 2 full revolutions of 360 degrees up from the 345 April low is 509.
MSFT struck 506.78 on Wednesday.
Will Friday see MSFT pinned at 510?
There’s another 5 star “N” general—NFLX
A monthly NFLX shows a false breakout in late 2021.
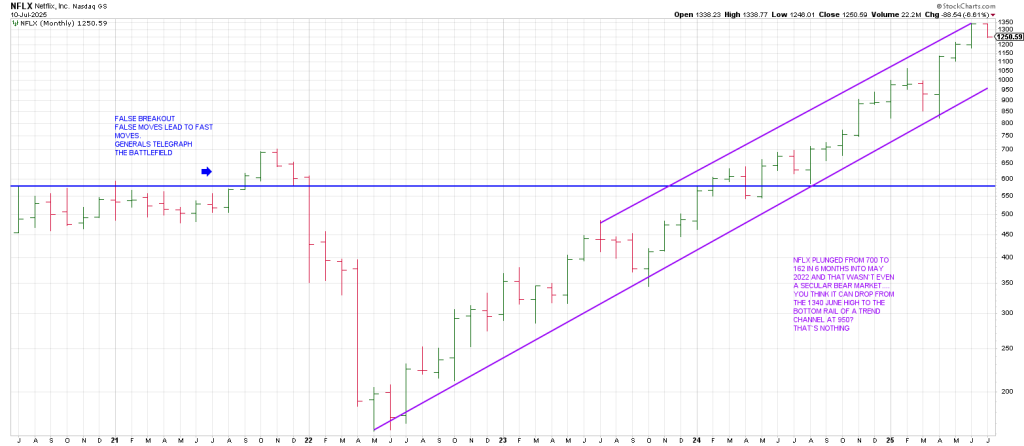
The reversal back thru the breakout pivot saw NFLX crash.
From a high of 700 NFLX plunged to 162 in six months.
And that wasn’t even a secular bear market.
You think NFLX can’t drop from its recent 1340 peak in June to the bottom rail of a trend channel at 950?
Theoretically breakage below the large trend channel opens the door to the 600 region—a 50% drop.
Drilling down to the weeklies shows NFLX has snapped a Bottoms Line from April and is sitting on the breakout pivot.
Failure below 1240 region opens the down door.
If NFLX is working on a false breakout, the notion of a 50% decline off the high is not far-fetched.
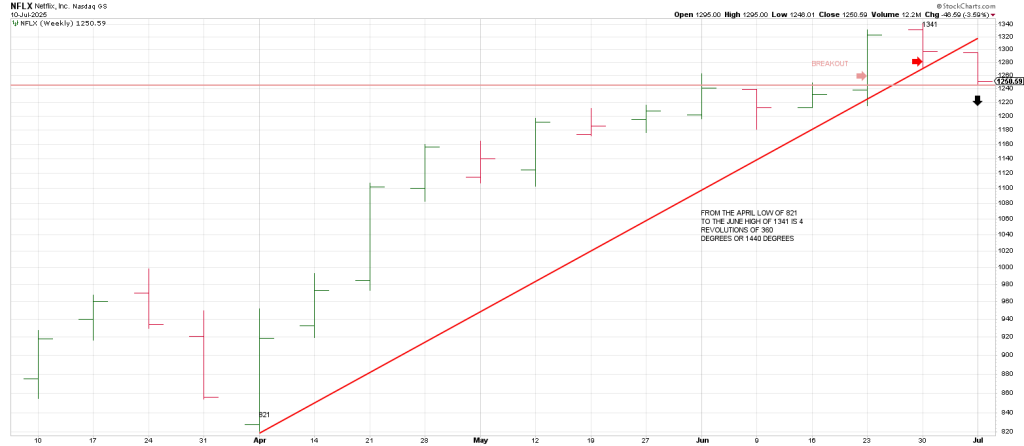
The Square of 9 shows that from the 821 low 1343 is four revolutions of 360 degrees or a key 1440 Fibonacci degrees.
NFLX struck a high of 1341 in late June…close enough for government work.
Dropping down the chain of command there is a group of 4 star and 3 star generals that fled the battlefield from commanding positions on Thursday. They saw something they didn’t like.
Names include
CYBR
ZS
CRWD
NET
SNOW
…to mention a few.
Many of these names are part of the Cyber ETF, HACK.
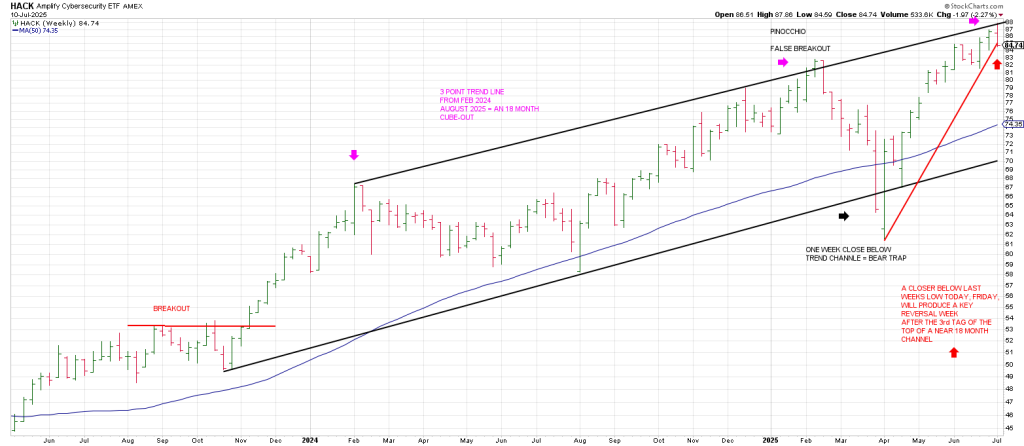
HACK plunged apx 4% on Thursday testing its 20 day moving average in one fell swoop.
A weekly HACK shows it kissed the top of an 18 month trend channel on Wednesday before reversing with authority.
Importantly I think, this is the 3rd test of the top rail of this trend channel
Notice the April low was a Bear Trap break below the trend channel, perpetuating a dramatic 3 month squeeze.
Now HACK is perched on initial weekly trend line support from the April low.
A close below last weeks low today will produce a Key Reversal Week.
The star of Thursday’s session was silver.
Let’s look at a weekly SLV first.
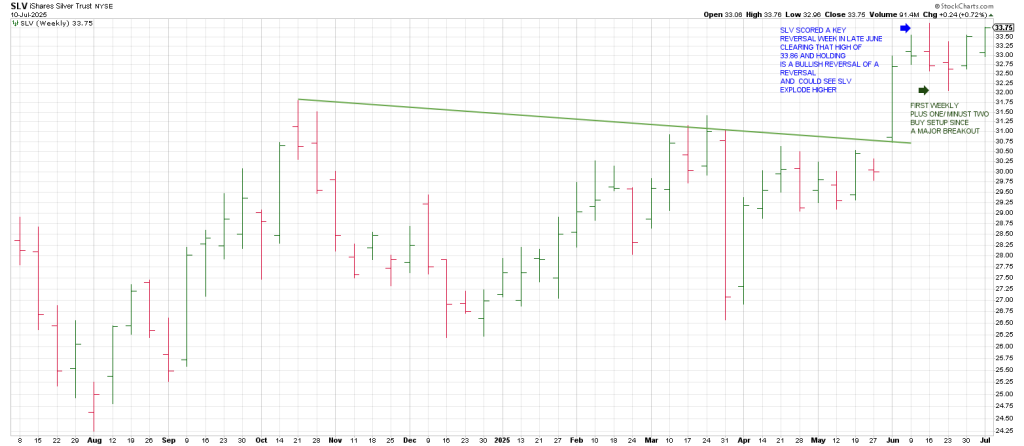
SLV produced a weekly Key Reversal sell signal in late June.
SLV is threatening to offset that reversal with Thursday’s action.
If so, it will trigger a Keyser Soze continuation buy signal.
This is what I call a Reversal of a Reversal.
Often times it precipitates fast moves.
Notice two weeks ago SLV carved out its first weekly +1/-2 buy setup since breaking out in late June.
That’s why we bought AGQ.
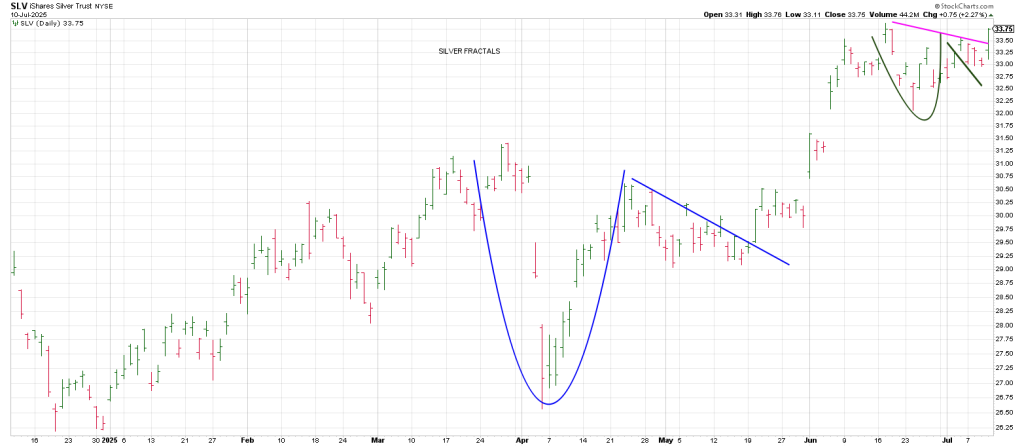
A daily SLV below shows the fractal in play.
If SLV comes out of the current high level consolidation like it did in June, it’s going to run.
In sum, the action in many leading tech names is a blaring warning.
Even if the index can push to 6300 for today’s OpEx Pinball,
However, as noted on Monday last week may have been the high for the move with a test
Into Thursday’s full moon cycle.
If so the market is vulnerable on Friday’s OpEx.
On the heels of a vertical move, a panic may start from a Friday in thin summer trade.

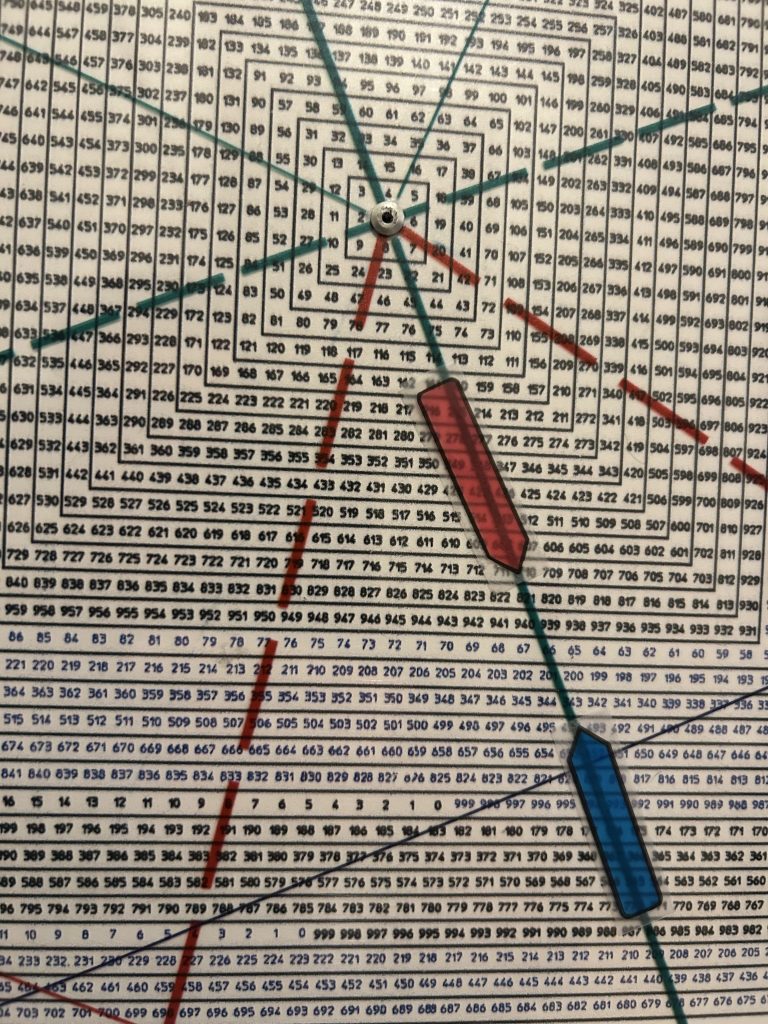
Square of 9 Wheel
Purchase your own Square of 9 Wheel. Shipping to US only. Contact Jeff for shipping outside the US.