“Your future bright
Beyond compare
It’s rags to riches
Over there
San Andreas Fault
Moved its fingers
Through the ground
Earth divided
Plates collided
Such an awful sound” Natalie Merchant, San Andreas Fault
“Between the idea and the reality
Between the motion and the act
Calls the Shadow…
This is the way the world ends,
Not with a bang but a whimper.” T.S. Eliot, The Hollow Men
The other Eliot—T.S. (not R.N. Elliott—as in Elliott Wave Theory) was wrong:
The world ends with a bang, not a whimper as Eliot wrote.
At least the stock market world.
As reported to readers late last week we got a second Hindenburg Omen observation last week.
This puts an official Hindenburg crash signal on the clock over the next several months.
It doesn’t mean a crash has to happen, but an H.O. was on the clock for every crash since 1986.
We also have a series of Titanic Syndrome warnings. This occurs when the market has reached a new high over the past 7 sessions with more stocks hitting new 52 week lows than highs.
Like the Hindenburg it confirms that under the surface of an index, individual stocks have been peaking.
The tip of the speculative sword is the NAZ where the “growth story” stocks reside.
Despite the NAZ running hot this month most days have seen more stocks at 52 week lows than highs. This has been the case in 9 out of 10 days.
There has been only one other instance in the last 40 years: late October thru early November 2007.
If you were trading at that time and heard about the disparity and the market just “hung in there” you probably would have said “indicator schmindicator”.
Indeed nothing happened following the October 11, 2007 all-time high until January 2nd, 2008 when the bear entered in earnest.
Mr. Market lulled the vast majority into a deep state of complacency.
The indicators came. The indicators went.
They didn’t matter until they mattered. As usual.
The vast majority were transfixed by the transactional tape.
It takes time for markets to turn, like a tanker, then all at once.
If Time turns trend how are we to know when to expect a change in trend?
The major Oct 27th SPX low was 4104 (410/411).
411 is direct March 21st which was a good high.
411 is 180 degrees opposition June 21st.
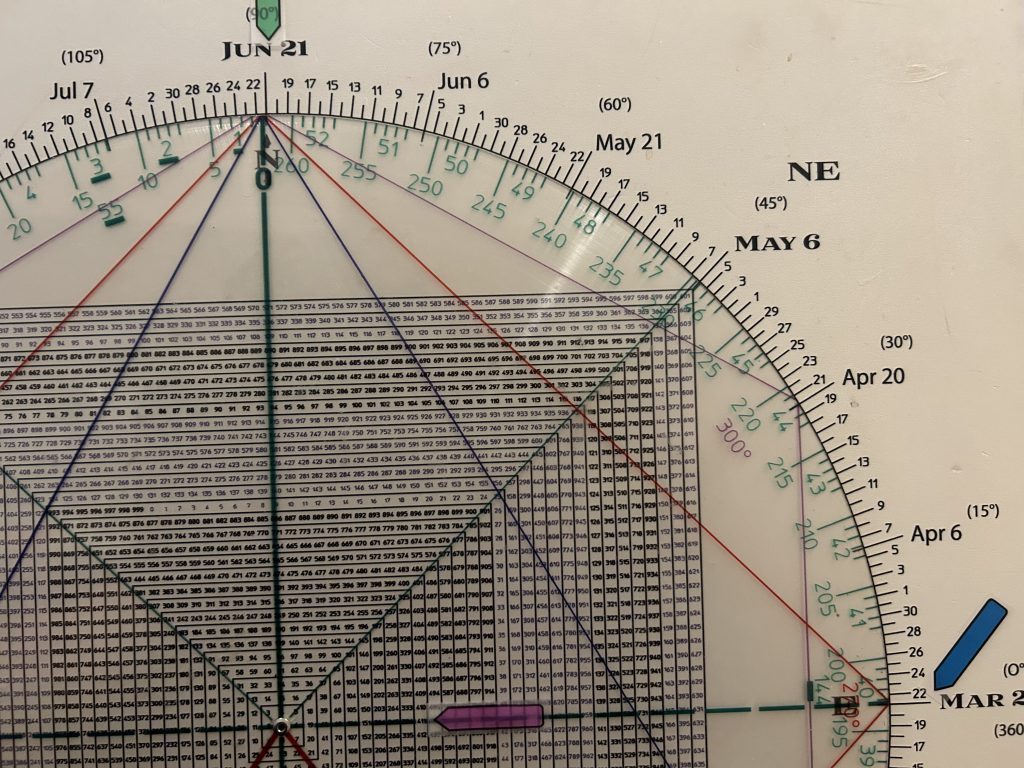
June 21st is 90 days/degrees from March 21st .
These “natural” seasonal periods and the numbers that fall on what is called the Cardinal Cross are considered naturally powerful numbers.
Clearly that was the case with 411 (4100-4110).
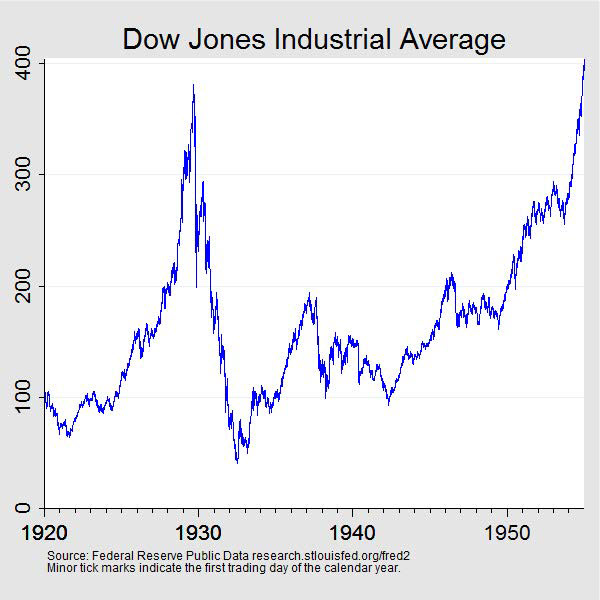
Theoretically if the SPX wants to mimic the blow off in 2000, or 1929 it could surge to 565 (5650).
So we have some good synchronicity indicating a turning point this week.
When markets run hard into a potential turning point, it often means the turn is significant
The last ditch rallies in 1929 and the current pattern here in 2024 are similar.
In early July 1929, the DJIA traced out a Flat, a consolidation pattern that lasted approximately a month.
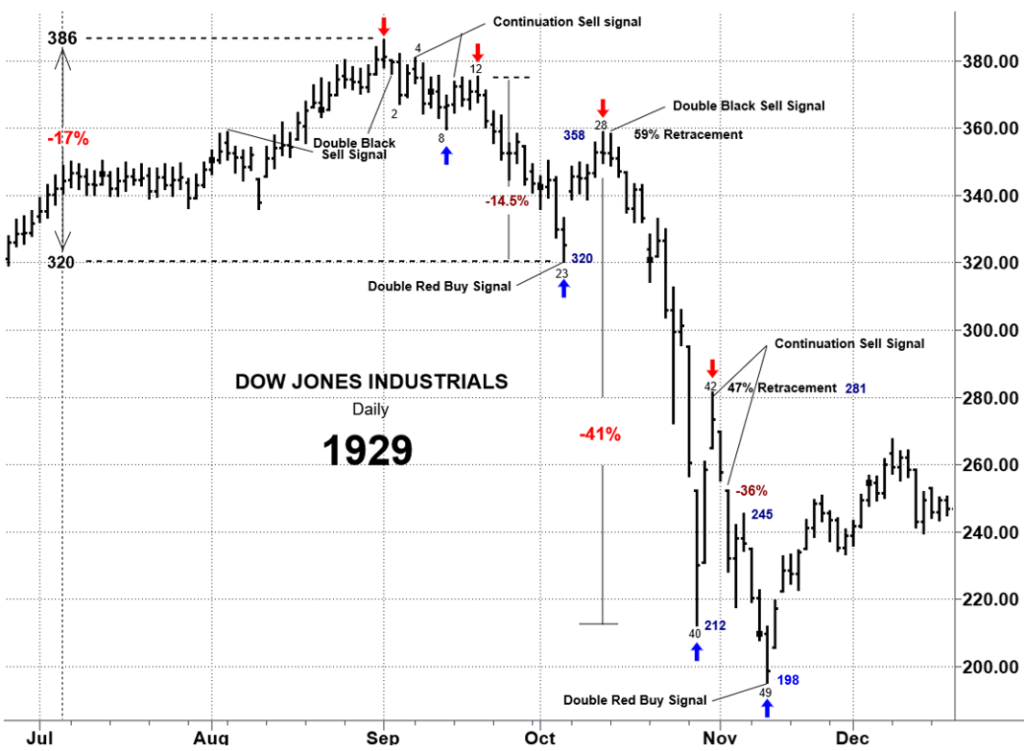
The DJIA broke out of the consolidation in early August followed by a shakeout.
The shakeout set up the last ditch run for the roses that lasted 16 trading days.
The current pattern shows a high on March 21st followed by downdraft/consolidation that ran from April 4th into May 14th …similar to the one month digestion phase in 1929.
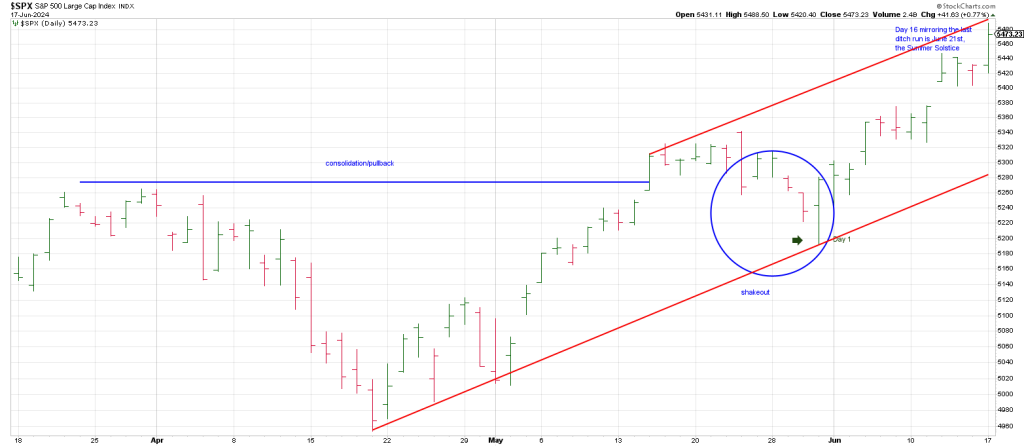
The SPX broke out to new highs on May 15th followed by a shake-out into May 31st.
My thesis is that the shakeout into May 31st, 2024 is analogous to the shakeout in early August 1929.
As with the DJIA in 1929, the SPX stood on its heels in following the May 31st shakeout.
Today was day 12 of the run.
The 16th day ala 1929 is Friday. June 21st.
Maybe something, maybe nothing; however, this is occurring within the context of my San Andreas Indicator.
It combines a combination of historically rich valuations, unfavorable internals, major divergences in the indices and long-term cycle analysis.
To recap the cyclic part of the indicator, we have a Low To Low To High Cycle on the table.
From major 1974 bear market low it was a Jubilee Cycle of 50 years.
50 years prior to 1974 is 1924.
While bottom prior to the Roaring Twenties bull market was in August 1921, the launching pad for the roaring party of the advance occurred in late May 1924.
This is when the DJIA came out of a multi-year Cup and Handle.
This major Low To Low To High Cycle combined with rich valuations and poor internals suggests my San Andreas Indicator is on the clock.
In sum, the final fling into September 3, 1929 was 16 trading days.
The 16th trading day from recent May 31st shakeout bar is Friday June 21st.
As offered above, March 21st squares out with the October 2023 low and is 90 days/degrees from June 21st,
The Q’s today are what the DJIA was to speculation in 1929.
Last week the Q’s broke out of above a Tops Line connecting the March highs with the May/early June highs.
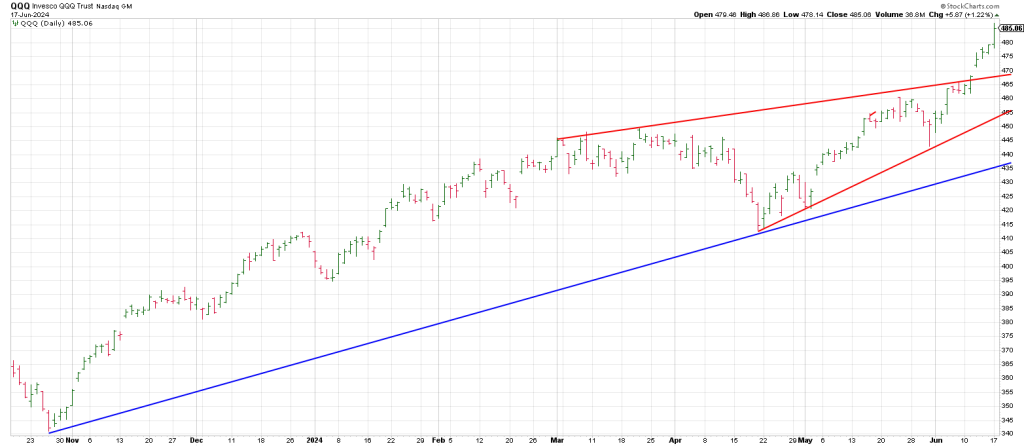
Breakage back below the open gap at 468 region suggests a Bull Trap of epic proportions is unfolding.
If the open gap is offset with a gap in the opposite direction things may accelerate quickly.
Trade below 455 QQQ warrants caution.
Below 435, get out of Dodge.
Yesterday the Q’s rallied hard as chips ripped.
QCOM exploded from 218.60 to 222.60 in 1 hour.
We flagged it on the Hit and Run Private Twitter Feed.
This morning, pre-market it’s up another 6 points.
QQQ closed at 485.86.
488/489 squares out with October 26, the low day in 2023.
This is because 488/489 is 180 degrees straight across and opposition Oct 26th.
April 19th, 2024, the last swing low squares out with 490.
488 to 490 sets up as a major upside pivot in QQQ.

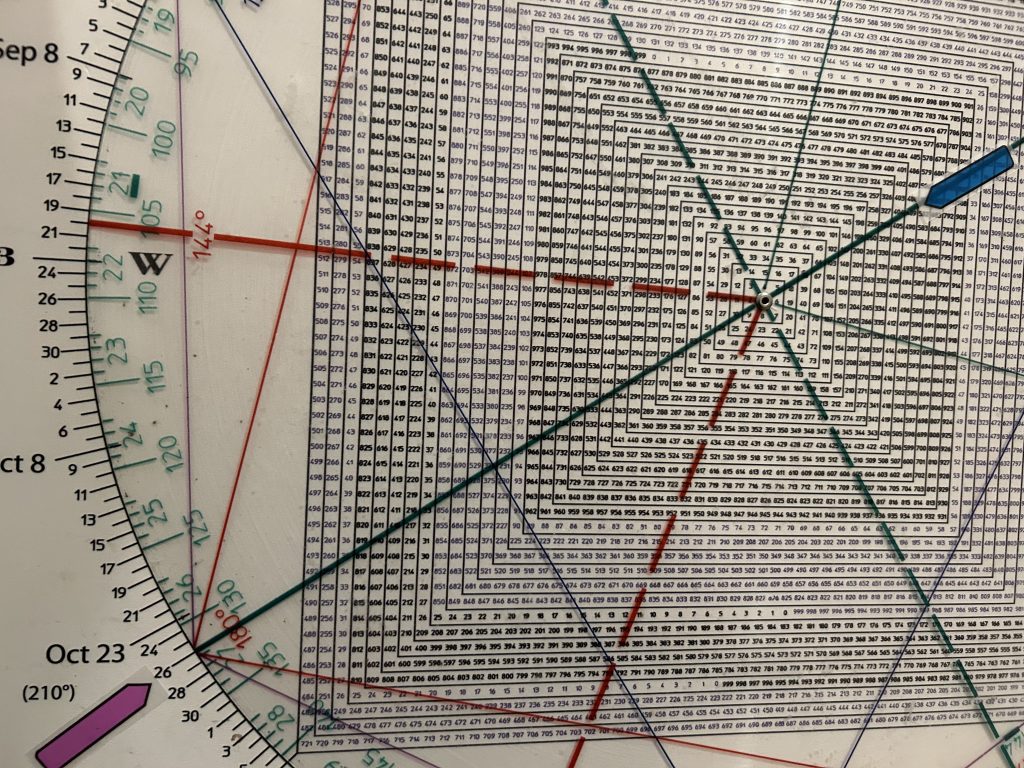
Square of 9 Wheel
Purchase your own Square of 9 Wheel. Shipping to US only. Contact Jeff for shipping outside the US.