Tuesday’s Roadmap called for a decline from the open into 10:15.
A solid uptrend into 3:00
And a pullback into the close.
A 10 min SPX shows the decline into 10:15 bottomed at 11:00 where a strong rally played out following an Reverse ORB (we had a down ORB first then an up ORB for a Reverse ORB).
We got a pullback in the last 40 minutes.
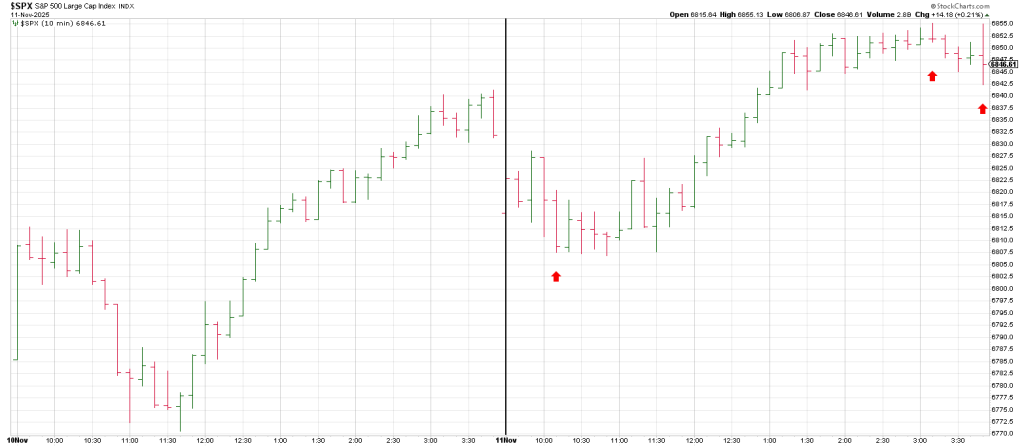
The Roadmap for today is as far from a trend day as you can get.
An early dip into 10:00 produces a rally into 11:00 where a deeper pullback plays out into 11:30 followed by a stronger rally than the early rally.
This rally lasts into 12:15.
Then you guessed it another pullback, this one sharper than the drop into 11:30.
This pullback plays out into 1:30 giving rise to a rally into 2:00.
Another sharp drop into 3:00 paves the way for a sharp rally into 3:30.
And just for giggles…another drop into the bell.
Tuesday’s rally satisfied two consecutive higher daily highs with the 3 Day Chart pointing down producing a Minus One/Plus Two Sell setup.
This is NOT an automatic sell. The price action, the behavior will determine whether the setup will get traction.
While the DJIA struck a new record high with a powerful 559 point gain driven primarily by defensive and value-oriented sectors, Tuesday was not an across the board show of strength.
The broader market failed to share in the enthusiasm.
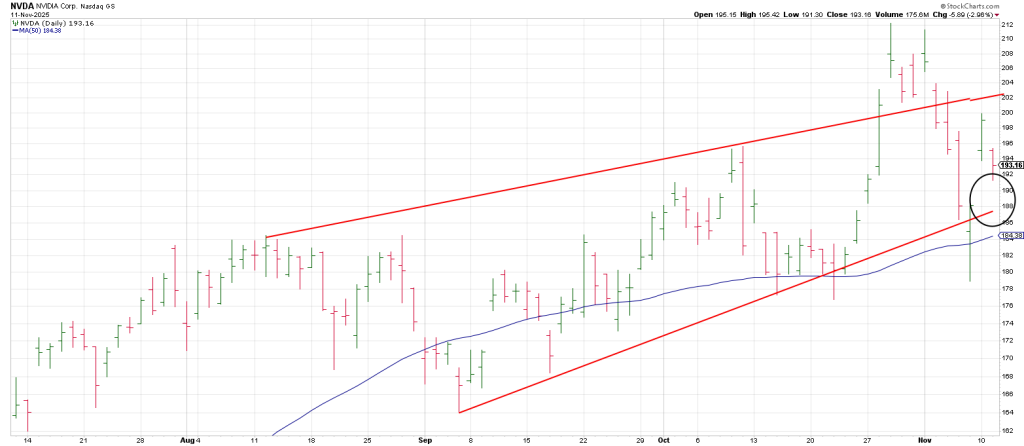
The SPX added a modest 14 points, while the NAZ slipped 58 points as tech sank.
The culprit was NVDA amid reports that SoftBank had sold its entire $5.83 billion stake.
The news dampened sentiment across the tech landscape.
Now we know what produced the series of 8 red candles in the last 10 sessions in NVDA.
Other chip names followed suit:
CAMT dived under its 50 day line and looks like it is intent to fill the open gap at 90.
AVGO was unable to hold onto its 20 DMA.
ARM is waterlogged below its 50 DMA.
LRCX gapped up to a record high on Monday but reversed closing below the gap leaving a Jump The Creek sell.
COHR gapped down into Monday’s Gap & Go. Downside follow through suggest Monday was an Exhaustion Gap.
AMD lows 6 point to 237.50 but after the bell surged on company comments unveiling medium term targets driving the stock to 249 after hours. Nicely timed Lisa.
Tech bled across the board on the heels of the NVDA news.
CRDO dropped back to test it 20 DMA.
WDC reversed from all-time high leaving a Lizard sell setup.
Ditto STX.
In contrast SNDK eked out a record high after pulling back initially.
ORC was red again for a change, but left a Lizard buy setup: following a new 10 day low (and a low for the move, ORCL closed near the open .
Let’s take a look at ORCL technically and see how the stories about circular financing and debt problems have translated into actionable trades.
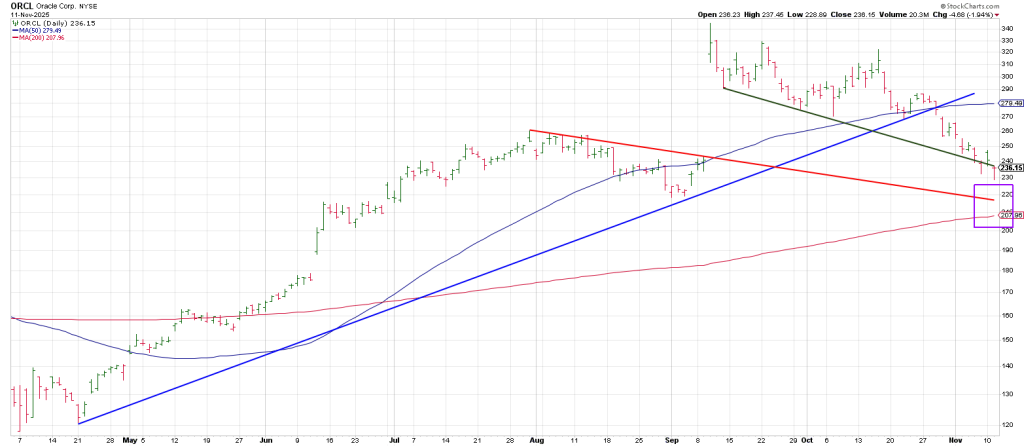
First notice from the 3rd lower high on October 24, a persistent down leg kicked off snapping the 50 DMA.
Fast moves often come from 3rd lower highs. This is my Power Surge pattern.
Notice the downside acceleration when ORCL broke a Bottoms Line from April.
Further notice a Ghost Line target a drop to the 200 DMA at 209.
540 degrees down from the 345 high is a cube-out at 243.
Another 90 degrees down is 228.
Tuesday ORCL hit 228.89.
720 degrees down from high is 212 close enough to the 200 dma that is rising.
The takeaway is that a counter-trend rally in ORCL should set up a nice short play.
Bask to 242/243?
A rally over the trend line connecting lows opens the door for a rebound.
In sum, the SPX closed on its high and the likelihood is it will turn its 3 Day Chart up today.
This is not the case with the Q’s that must rejigger the count from zero.
The Q’s must also contend with the right side of a 6 Day Island Top at 627 to 630 ish.
The DJIA new all time high in contrast to the pattern on the Q’s shows money is getting defensive
About cracks in the AI narrative and deploying into “value” stocks….albeit doing so euphorically…
Chasing.
The breakout from a February/March Tops Line occurred in late April.
180 days/degrees later is the Oct 29 SPX all time highs.
On May 12 the SPX gapped higher starting a Tractor Beam rally.
Today are 180 days/degrees from that May 12 gap.
So the price action going forward is going to be critical.
Clearing the Oct 29 all-time high suggests a push to 7030 (703 square-out on the Wheel_.