“I should have known it hard to believe
It was all right there in front of me” I Should Have Known it, Tom Petty
“God Geometrizes” W D Gann
“Wall Street never changes, the pockets change, the suckers change, the stocks change, but Wall Street never changes because human nature never changes.” Jesse Livermore
The Square of 9 Wheel pictured below is the physical embodiment of the Principle of Squares.
The Principle of Squares proposes that all growth is logarithmic not linear.
And, that growth is deterministic, not random.

Square of 9 Wheel
Purchase your own Square of 9 Wheel. Shipping to US only. Contact Jeff for shipping outside the US.
As Einstein’s Theory of Relativity states, spacetime is not flat; it’s curvilinear.
Succinctly, both time and space (price) are curved and hence, repeat.
Integrating the square-outs from the Square of 9 Wheel with trend lines and moving averages produces a powerful technical trifecta.
Allow me to explain using a weekly SPY from the March 2020 crash low.
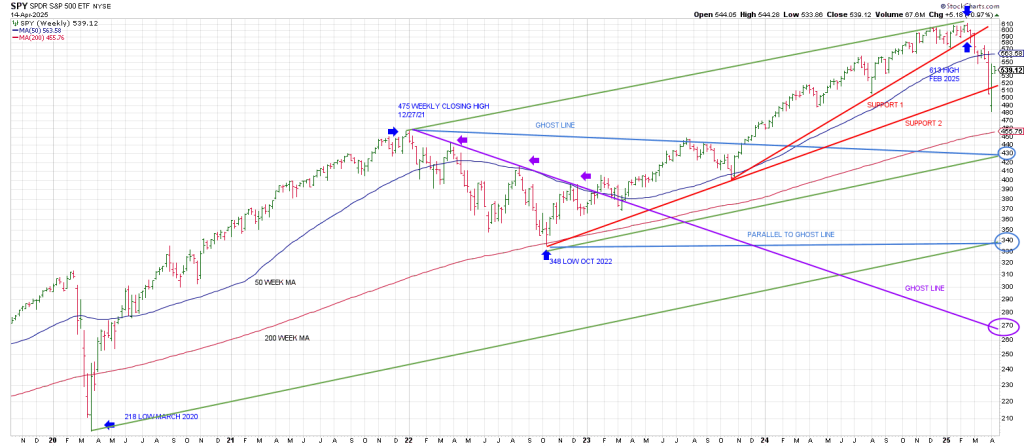
I connected the late December 2021 top with the January/February 2025 top and paralleled a line off the March 2020 crash low forming a trend channel
1)The bottom rail of that trend channel ties to the 340 region over coming months.
This ties to the October 2022 low of 348.
2) I also paralleled a line from the October 2022 low with the Tops Line connecting the Dec 2021 top and the 2025 peak. That parallel like comes in at the 430 region over coming weeks.
Those are the two green rising trend channels
3) Connecting the Dec 2021 top and the July 2023 peak (light blue) hits the middle green Bottoms Line in the 430 region presently. That should present an area of potential support.
4) I paralleled a line off the aforesaid light blue Ghost Line from the October 2022 low. It ties to the 340 region presently, roughly synchronous with the October 2022 bottom.
The takeaway is 430 SPY is an important pivot. Breakage below that opens the door to a test of the October 2022 low at the 340-345 region.
Breakage below 340 opens the door to the 270 region which roughly ties to the triple bottoms in 2018 (February, April and October which when broken produced a crash into December).
5) Initial support was broken in March when a 3 point trend line snapped (Rule of 4). Support #1 gave way to a break of support #2 which perpetuated our long standing objective for a waterfall decline to play out starting in January 2025 that tested the 4800 to 5100 region.
Support #2 was recaptured last week.
Those are the trend lines and Ghost Lines that appear operative.
The moving averages shown are the 50 week (blue) and the 200 week (red).
Notice that the 200 week moving average was tested/undercut in March 2020.
In 2022 it marked the low.
It has not yet been tested. The presumption is it will be tested given the angle of attack to the downside.
Currently the 200 week moving average resides at 467. Interestingly just above the 430 “intersection” on the above chart.
The 50 week moving average at 567 should present beaucoup resistance.
But before that can be entertained, the SPY must recapture a 50% retrace of this years range which is 547.50.
Basically where last weeks spike was rejected.
In sum, clearing and holding above 548 opens the door to 567.
The third leg of the technical trifecta is the square-outs projected by the Square of 9 Wheel.
“When time and price square-out (balance out) expect a change in trend.” WD Gann.
Let’s start with the 5 year cycle low of 218 in March 2020.
A square of 9 shows that 218 aligns with, is on the same axis as 613, the all-time high.
In other words the 2025 all-time high vibrates off the Covid Crash low in keeping with Gann’s Law of Vibration.
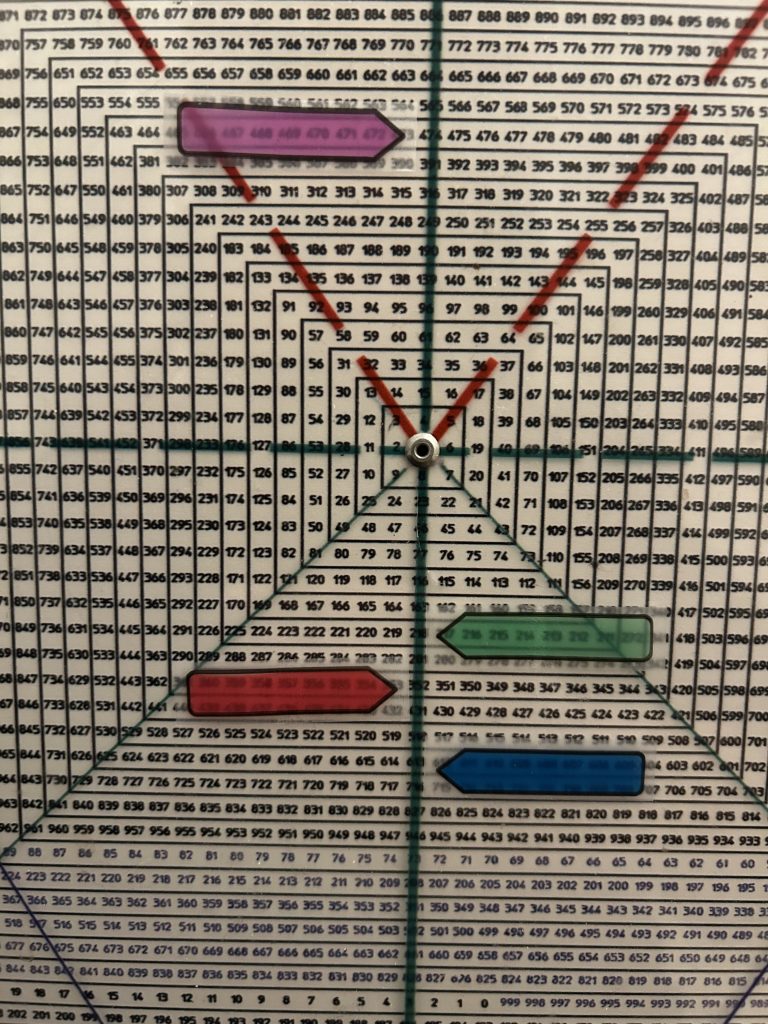
Amazing
Notice that 352 is on the same axis.
The Oct 2022 low is 348. The SPY closed well off that low on the week at 357.
So 352 splits the difference.
The other major turning point on the chart is the 475 December 2021 weekly closing high of 474.96.
474 is on the same axis as 218, 352 and 613!
I don’t think that is happenstance. Thse are the biggest turns of the last 5 years.
Amazing
You can’t make this stuff up.
You think the market is random? Think again.
In sum, the last thing the vast majority of market participants was looking for was a waterfall to kick off 2025.
It was predictable using a little the Square of 9 and the 5 year cycle…which topped in January/February 2020.
The impulse to buy the dip prevails. Because most investors believe the market always comes back.
That’s all I hear from retail.
It’s because it takes work to learn the language of the market.
But it pays dividends. People buy stocks as if making money in markets is a given, whereas they wouldn’t dream of practicing brain surgery without years of study.
You can’t expect to make money doing the same thing as everyone else.
For this cycle Buy the Dip is dead.
Hit and Run is king.
Let’s look at an example of how we use the Square of 9 in real time trading.
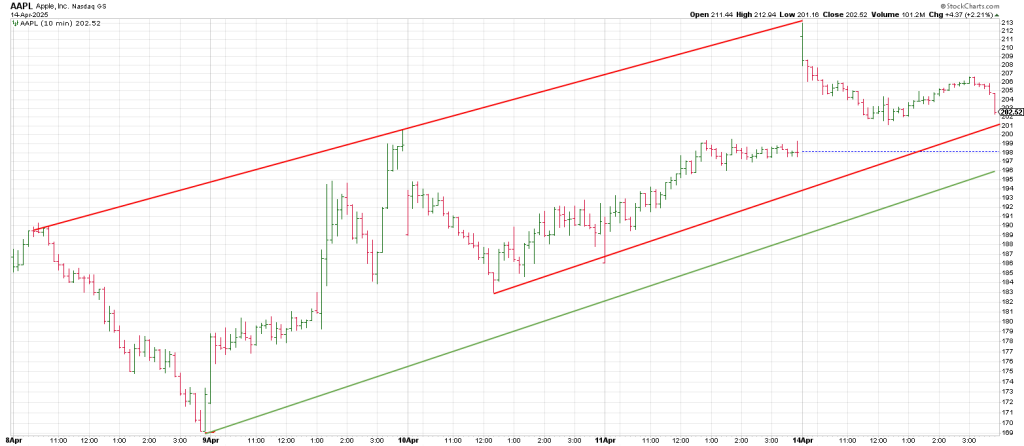
Before Monday’s open we noted that despite AAPL’s 13 point indicated gap open,
It setup short.
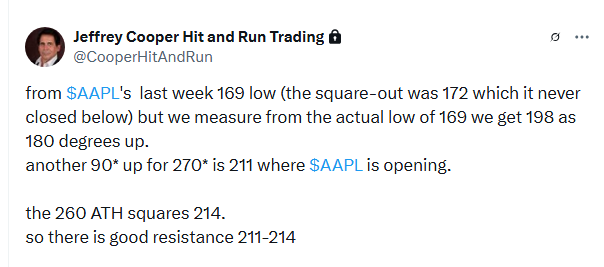
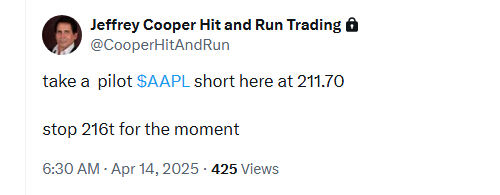
AAPL pushed to 212.94 then started rolling over.
An Opening Range Breakdown put opened the door lower with AAPL closing well off the square-out highs at 201.
The AAPL square-out proved to be a good tell for the overall market with the SPX giving up the ghost on a 100 point gain in the opening minutes Monday to slip into the red and Phil D Gap momentarily before rebounding toward session highs when a late day swoon dictated the runoff.