“Desperado, why don’t you come to your senses
You’ve been out ridin’ fences for so long now” Desperado, Don Henley, Glenn Frey
“As soon as the idea of the Flood has calmed down,
A hare stopped among the sainfoins and the swinging bellflowers
And prayed to the rainbow through the spider’s web.” Apres le Deluge, Arthur Rimbaud
The market has arrived at an important inflection point.
It’s been riding the fences in 2025:
The SPX gave us a plumb line drop of 1312 points in 7 weeks falling into the heart of
W.D Gann’s so-call Panic Zone.
It was followed by a stunning 4 week surge.
Did a Bear Market start in February with a retrace into this week
Or did early April mark another flush out low?
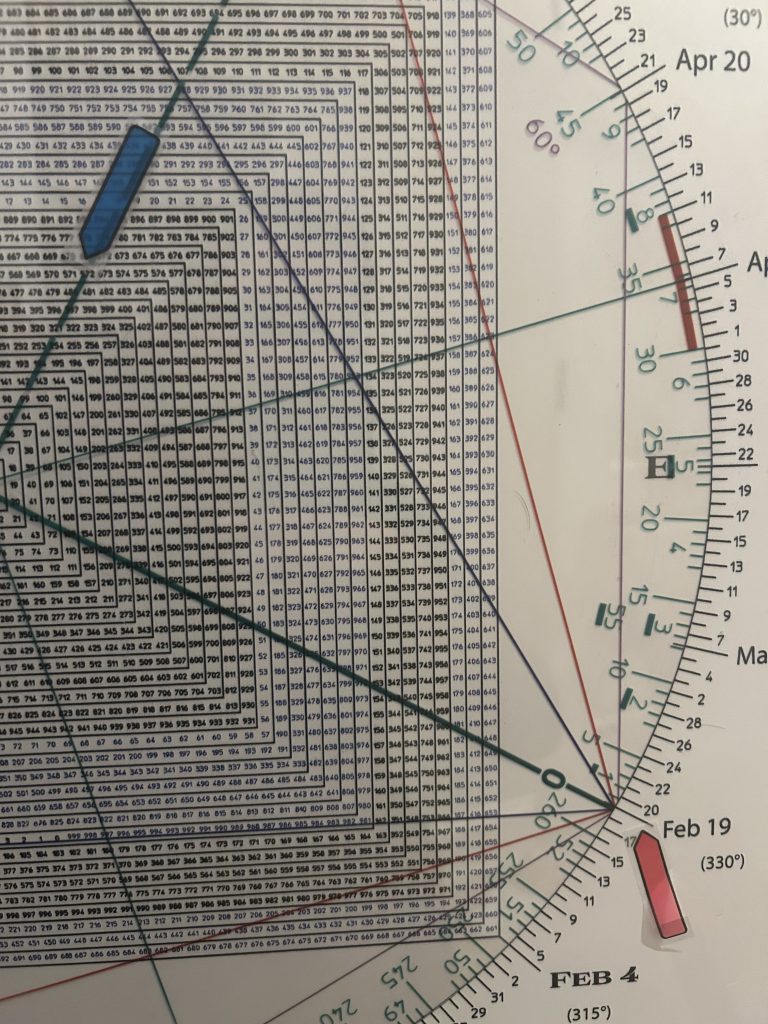
Interestingly 1312 on the Square of 9 Wheel aligns with/points to the first week of April…the low.

In ranching the term “riding the fences” refers to a cowboy who rides along the fence lines to check for damage.
Figuratively, it means to be unable to commit to either side.
So far in 2025, Mr. Market seems unwilling to commit to either the bear side or the bull side.
As the vast majority of market participants were buckled up for a continuation of a raging bull in 2025, Hit and Run warned last fall about a significant January top.
Apres le Deluge into April 7th satisfied our expectation for a test of the January 2022 bull top, fences were mended by a slew of well spun Tariff Headline Roulette tape bombs.
Why the projection into the 4818 January 2022 top? Prior resistance is supposed to act as new support.
It did.
Thursday we got the announcement of a tariff deal with the U.K.
This weekend I’ts Switzerland for China and the U.S.
Will it be a Swiss Miss?
Is it a classic Sell The News headline?
A weekly SPX shows the Flood and how Moses or Bessent or someone parted the Sea of Red letting the bulls cross into what many perceive to be the promised land, a land where anything more than a few months of declines has been banned by decree.
But now it’s a Come To Jesus Moment for markets.
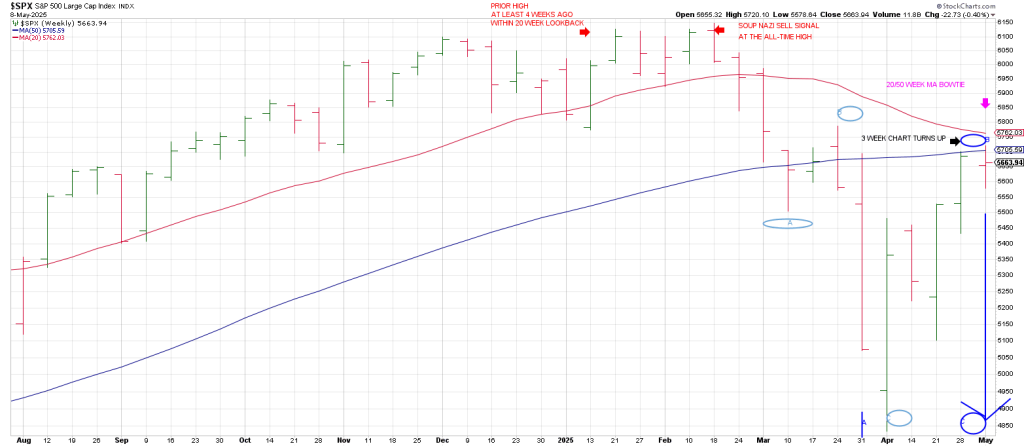
This week the SPX turned its 3 Week Chart up for the first time since turning it down right off the Feb top.
The 3 Week Chart is a hallmark of our method for determining the intermediate trend.
If the market is truly bearish this turn up of the 3 Week Chart will define a high soon in terms of time and price.
If the market is bullish, a turn back to the topside by the 3 Week Chart will see a continuation of the rally… a knee-jerk reaction first, notwithstanding.
This turn up of the 3 Week Chart comes at a Bowtie of the 20/50 week moving averages.
Interestingly it was a pullback to the SPX 50 week moving average in October 2023 that defined a Secondary Low and produced a 2000 point run for the roses.
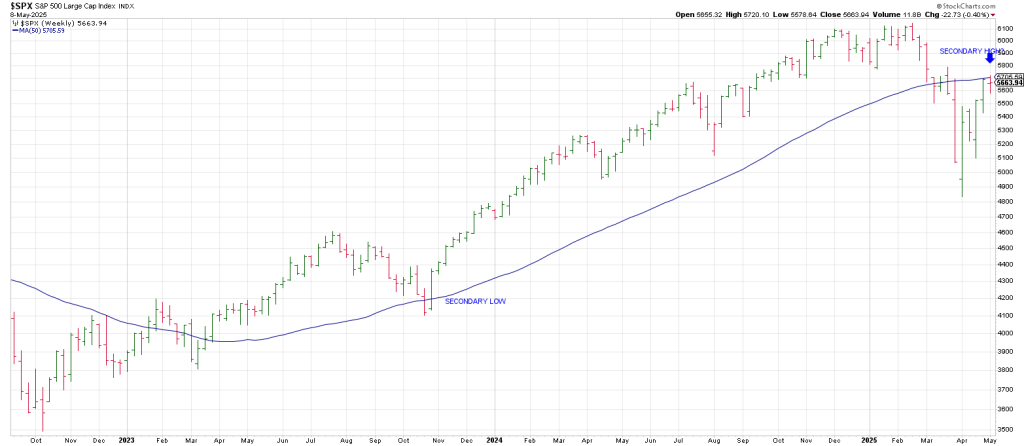
Is it possible we have a Secondary High now.
Yes.
As Above, so Below as W.D. Gann stated.
The two most important lows since 2020 are March 23, 2020 and October 13, 2022.
From the Oct 13, 2022 low to today is the same number of days from March 23, 2020 to Oct 13, 2022.
A possible Low to Low to High Cycle is on the table.
On Thursday the SPX left a Combo sell signal
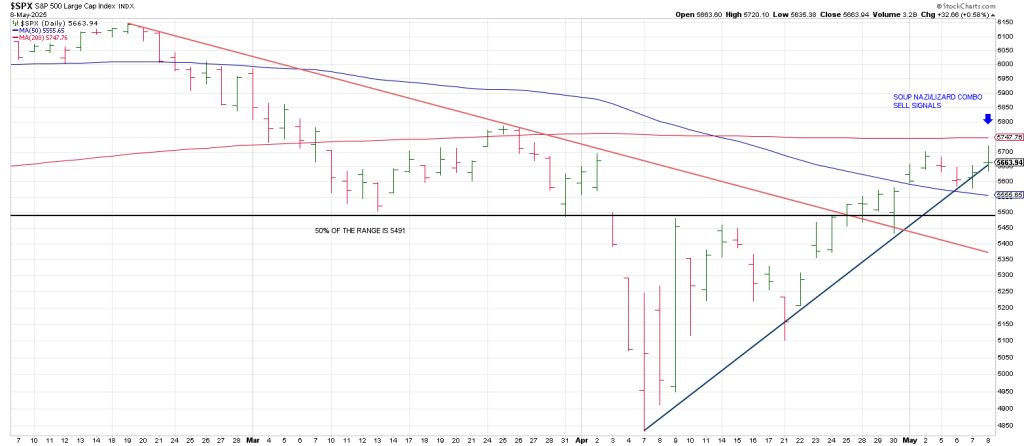
Yesterday the SPX left multiple signal bar reversal sell signals:
1) A Soup Nazi sell. This is a pattern I developed that does a good job of identifying ‘test failures’.
It is a new 20 day high with a stab back down through a prior high within that 20 day lookback with at least a 4 day interval. The 4 day interval is to protect against continuation moves.
Yesterday the SPX drove above last weeks 5700,70 high and jackknifed back below it, closing convincingly below 5700.70 at 5663.94.
2) The SPX also left a Lizard sell signal. This is a new 10 day high Topping Tail, a new 10 day high with the open and close near the bottom of the day’s range.
3) The SPX went into my daily Minus One/Plus Two sell position on Thursday. The 3 Day Chart is pointing down (Minus One) followed by two consecutive higher daily highs (Plus Two). This is the cornerstone of my Swing Method.
These three signals have played out on a backtest of the declining 200 day moving average in concert with an extreme overbought condition.
As well as one of our members on the Hit and Run Private Twitter Feed pointed out, 572 (5720) squares-out with May 8th.
As depicted in the weekly SPX above the structure looks like the C Wave of a counter trend A B C rally is ending.
It looks like the SPX completed an A Wave decline into April 7th.
I cannot see 5 waves down only 3 so the indication is an A B C decline into early April followed by a bearish 3 Wave A B C advance in May 8..
There are alternative interpretations but this is the most likely from mmy perspective.
The other’s will depend upon the nature of the next pullback—whether it is corrective (bullish) or impulsive (bearish).
C waves are vicious. Notice the C wave decline from March 25th to April 7th.
A weekly C Wave decline from current levels targets a minimum of 1312 points of the Wave A decline.
From the current region that projects to 4408.
It may be 1.618 X as large which targets a test the 3490 October 2022 low.

Square of 9 Wheel
Purchase your own Square of 9 Wheel. Shipping to US only. Contact Jeff for shipping outside the US.