“With a heave and a ho,
I just couldn’t let her go.” The Tran Kept A-Rollin’, The Yardbirds
“The diabolical purpose of the market is to continue higher (or lower) with as few people on board as possible.” Jesse Livermore
Yesterday marked the 13th consecutive session with a negative McClellan Oscillator.
It is the longest uninterrupted stretch of internal weakness ever recorded during an ongoing series of new SPX highs.
Over this span the SPX touched record levels on eight sessions including Wednesday’s advance of 39 points.
Despite the headline gains, the internal data continue to reflect persistent erosion in participation, as advancing issues fail to confirm the strength in the indexes.
History is clear: this will end badly, very badly for the market.
History is also clear that these divergences do not time the precise top:
Indicators are more descriptive than predictive.
It is time that turns trend, not indicators.
When time is up trend turns.
If there is one idea that you take away from my work it is the above.
Let’s look at one aspect of time, 7 years from the January 2018 high.
Let’s look at the 20 week vertical advance from September through January 2018.
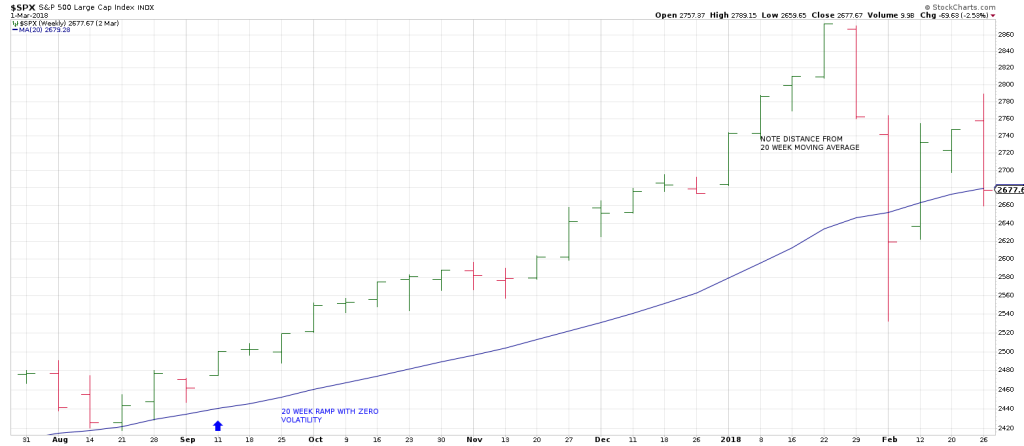
Throughout the ramp, the 20 week moving average remained untested.
Notice the distance from the 20 week moving average into the January 2018 high when finally reversion to the mean struck producing not just a test of the 20 week but a large Undercut.
Checking a weekly from the April 2025 low there is a similar
20 week vertical advance from June.
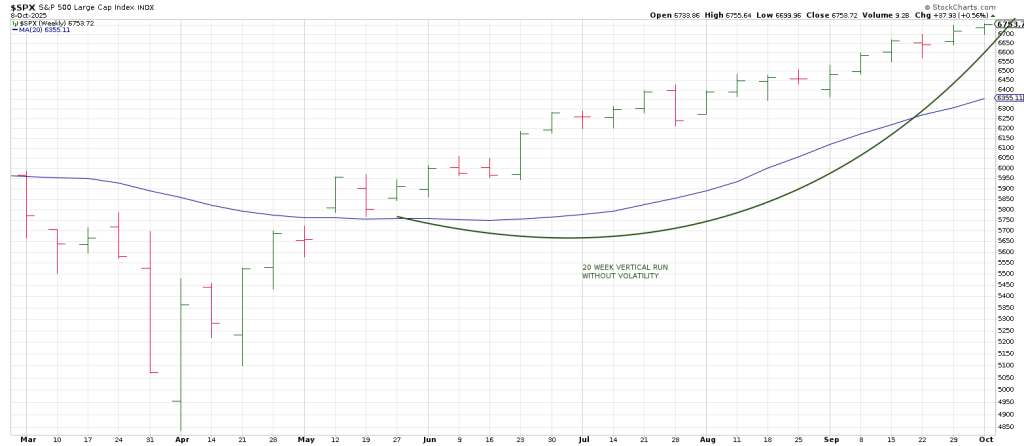
Once again notice how far the SPX is from its 20 week MA.
Notice that the 20 week moving average has not been tested since price gapped above it in May 2025.
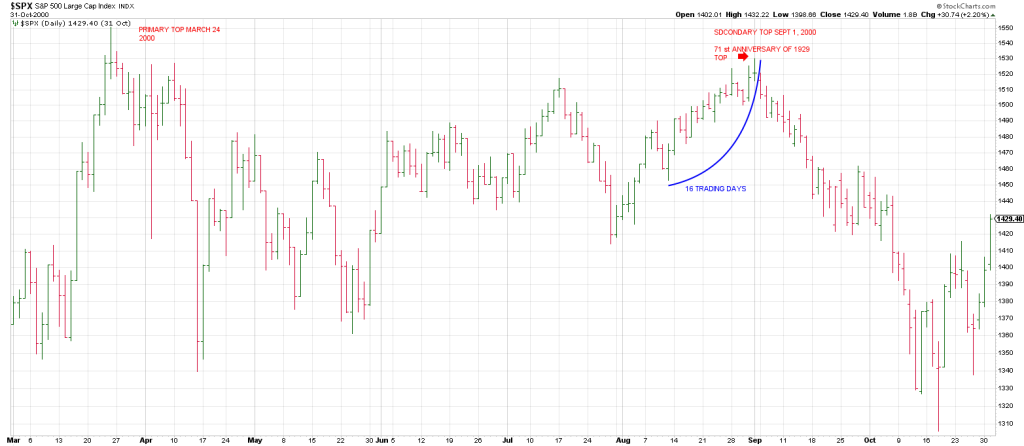
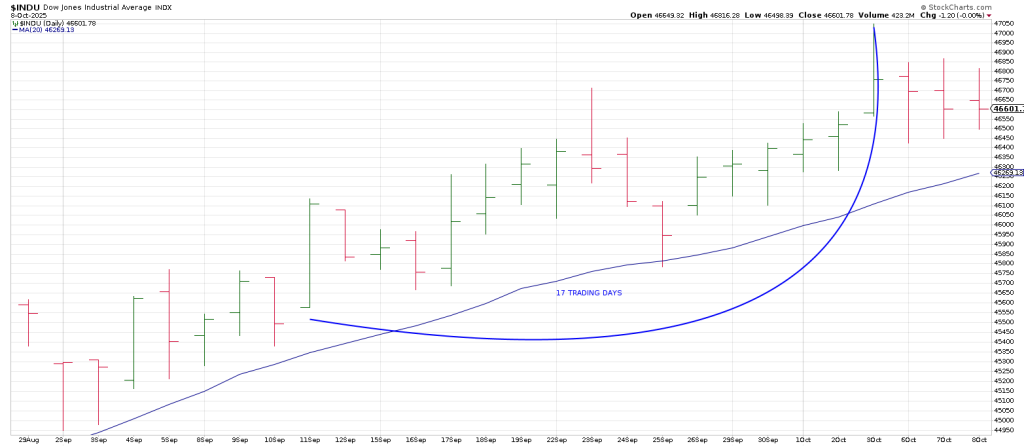
Another element of time is the similarity in the 16/17 session run to the top day in 1929 and the 16 trading day run to the Secondary Top on September 1, 2000.
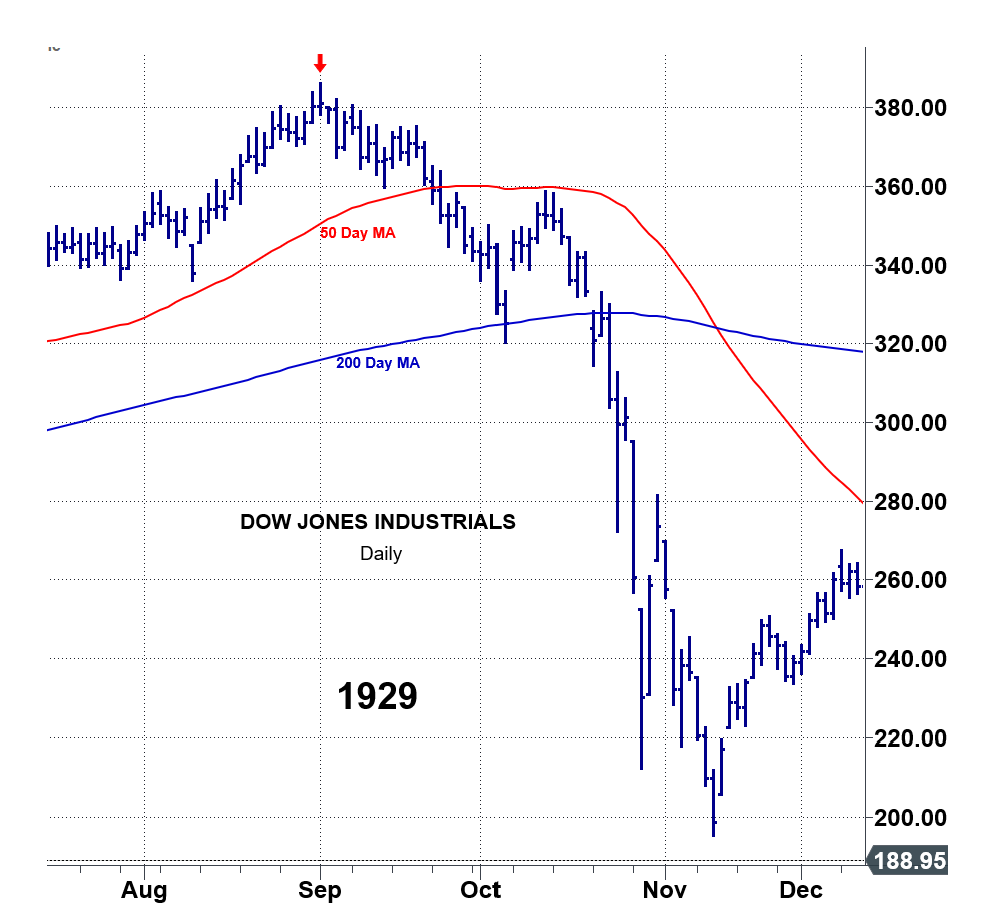
Ditto the 17 trading day run in the DJIA to last weeks all-time high.
In sum, under the cover of the SPX testing the key 6750 square, momentum erupted in many generals on Wednesday.
SNOW, DELL, SNDK, CRWV and ASTS to mention a few.
Whether this is telegraphing a new leg up or climactic, I think we will know before the weekend:
Either the SPX is tracing out a Pinocchio of the 6750 square or it has triggered a Keyser Soze with its close over Tuesday’s Key Reversal Day.
Follow thru will be key.
Keep in mind the SPX/DJIA does not look like it’s in a runaway move of late with nominal new highs and sell offs, nominal new highs and sell offs.
If the dominoes fall to the downside producing reversion to the mean, we could yet see a red October… just as euphoria is all dressed up to gift the bulls with what they assume will be a non-stop melt-up into January.
At least that seems to be the popular consensus.
The market is seldom that accommodative.
Watch the metals for a possible rug pull: SLV satisfied the 45 target and GLD satisfied a square-out on Wednesday.