A friend and fellow trader shared the following chart with me that pretty much sums up my thinking.
NVDA topped on the summer solstice, due north, and spearheaded the AI Crash.
Then we had the Japan Carry Crash following the non-farm payrolls released on August 2, 2024.
Notably each pivot high prior to a plunge was marked by an economic print.
Yesterday we had the CPI and the SPX was all over the map intraday.
A rally on the run-off saw the index settle right on its 50 day line.
The SPX has carved out 3 lower highs from its all-time high.
The first lower high was July 23rd. It was followed by a Breakaway Gap.
The second lower high was on July 31st. It was followed by a Large Range Outside Down Day (LROD /Lightning Rod) on August 1st.
We are at well-defined resistance which if it sticks will be a 3rd lower high.
Fast moves come from 3rd lower highs which is why I call them Power Surge setups.
Let’s recap the well-defined resistance again:
- We have satisfied Phil D Gap from August 2nd.
- We have backtested a Ghost Line from the little Rule of 4 Sell signal on August 2nd.
- The index has kissed its flattening 50 DMA
- The index has struck my daily Pocket Pivot Indicator for the second time since the ATH. The last time was July 31st.
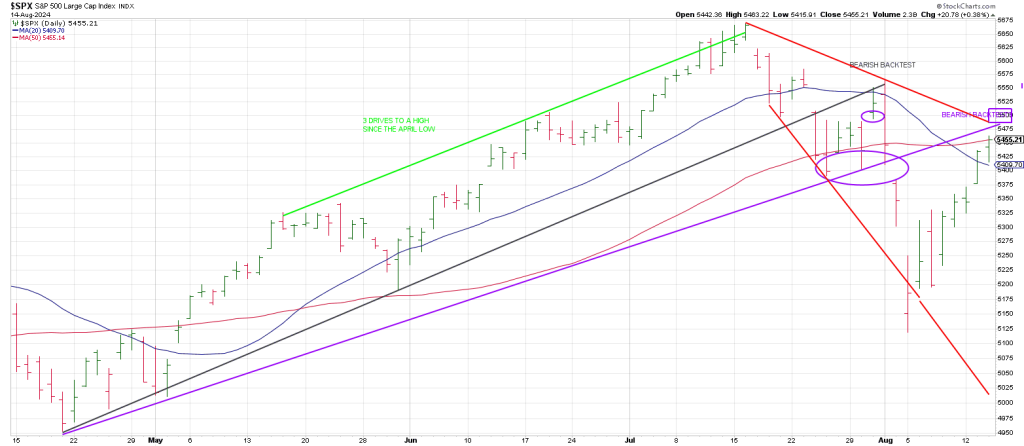
Let’s take a deeper dive into the SPX dailies from the April low.
- From the April low the index shows 3 drives up to the July all-time high in 13 weeks. this mirrors the 14 week blow-offs in 1929 and 1987. Just sayin’.
- A Bottoms Line (grey) connecting the April low and the May low was broken and backtested on July 31st. All hell broke loose.
- A Bottoms line (purple) connecting the April low and the July 25th low is in the process of being backtested. Will the SPX fully backtest the line with a push to 5475/5500 or remain shy. This is the trillion dollar question. A push higher also hits the Tops Line (red) from the all-time high.
- This ‘intersection’ at 5480-5500 satisfies a possible Time/Price square-out: 550 (5550) points to August 15/16th. This of course is the August Monthly OpEx.
In sum, Monday August 5, 2023 produced one of this decades’ seven most intense decline days.
The declining volume outweighed the advancing volume by the highest ration of the year at 13.2 to 1.
Declining issues of 2658 (the heaviest of this year) also outweighed advancing issues by that same 13 to 1 ratio.
It’s not unusual to see a bounce back after such extremes. But this is more than a bounce.
It’s a vertical rebound. It’s unusual.
It reeks of a stick save.
It tells me how profound the issues were going into Monday August 5th.
Yes, the square-out on Monday morning pre-open at 508 SPY worked amazingly well.
Yes, on Monday’s close many key stocks were sporting large range Gilligan buy signals.
Names include NVDA, AMZN and CRWD to mention a few.
Were the Gilligan buy signal and the 508 SPY square out telegraphing this kind of reversal or was it a self-fulfilling stroke of The Hand?
I am told the trillions of dollars that U.S. banks have in the carry trade were showing a nice gain on the currency side of the arbitrage as the Yen depreciated of late. However, their tangential investment in bonds amounted to a net loss on the arbitrage in the trillions.
So a monumental Stick Save was showed up…but they waited to market was sufficiently flushed to unleash The Hulk.
Longs In The Loop were emboldened when last Thursday’s Flying Elvis rip cord was yanked.
The market hasn’t looked back since with the SPX marching to its date with destiny at the 50 day line.
The SPX has not turned its dailies down since the August 5th low. The behavior following the first daily turn down will be telling.
If the SPX is tracing out a Wave 2 high following a Wave 1 decline into August 5th (which marked 5 waves down of a smaller degree), the next leg down will be a dramatic Wave 3 slide.