“Believers keep on believin’
Sleepers, jus stop sleepin’
Cause it won’t be too long” Higher Ground, Stevie Wonder X Red Hot Chili Peppers
“The stock market is filled with individuals who know the price of everything, but the value of nothing” Philip Fisher
“Any fool can believe the truth, it takes a genius to believe a palpable lie.” Anon
Many years ago a friend of mine who had been a trader for one of the largest mutual funds in the world told me a story about a quarter-end strategy they would use.
An American Ambush.
Going into the last 3 to 4 weeks of the quarter, the mutual fund would buy the biggest winners slowly at first then promiscuously.
As the stock grinded higher, they took offers relentlessly causing these Red Hot Winners names to go vertical…forcing their competition to buy these same winners at nose-bleed levels.
Then, about a week before quarter-end the mutual fund would hit bids indiscriminately.
This caught their competition flat-footed—especially going into quarter-end.
Like right now.
The competition were deer in the headlights.
These red hot winners were well above their 20 and 50 DMA’s so the “trend was up” so to speak.
Having been ‘snaked’ this gave the other mutual funds some false solace that since they were the biggest names that quarter, they would rally back into quarter-end.
Typically they would not. They had been knee-capped…technically and sentiment-wise, making a run the last days of the quarter a tall order.
This strategy gave my friend’s mutual fund employer performance edge at the end of the quarter…sometimes as much as 2 to 3%.
OKLO may be a good example. I don’t know if it’s in the “loop” for this setup but the chart speaks for itself.
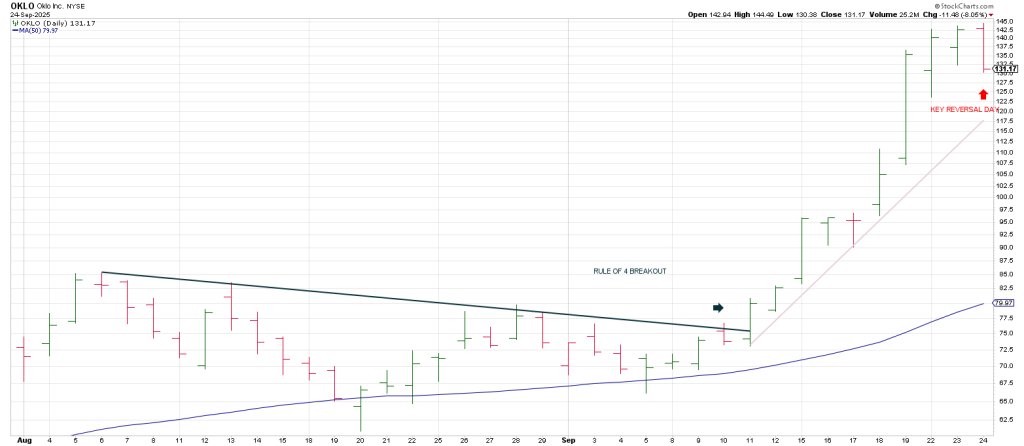
OKLO broke out of a Cup and Handle early this month and Hit and Run took it on a swing.
We didn’t get the crème de la crème of the move.
Wednesday OKLO carved out a Key Reversal Day.
Wednesday night I understand Goldman downgraded it.
Just coincidence I’m sure.
Stocks can turn on a dime; most traders cannot.
OKLO isn’t alone when it comes to Red Hot Winners becoming Red Hot Dippers on Wednesday.
Names include
ALAB
SITM
STRL
And CRDO
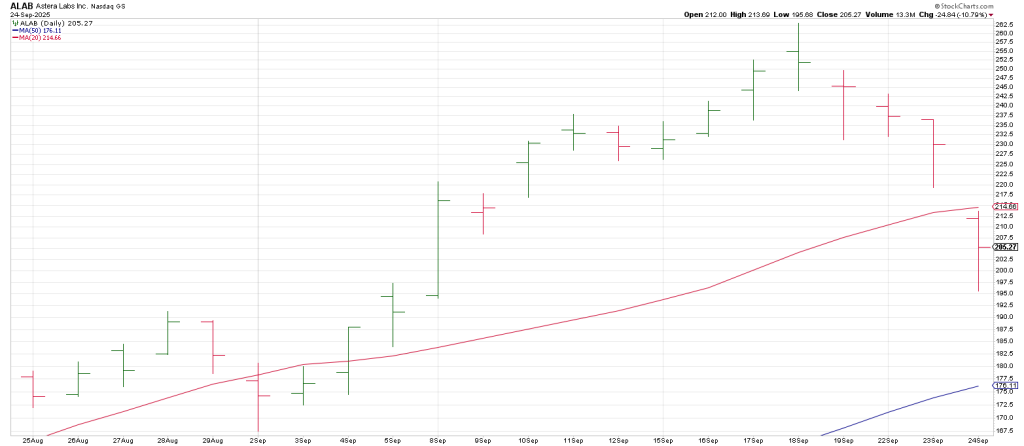
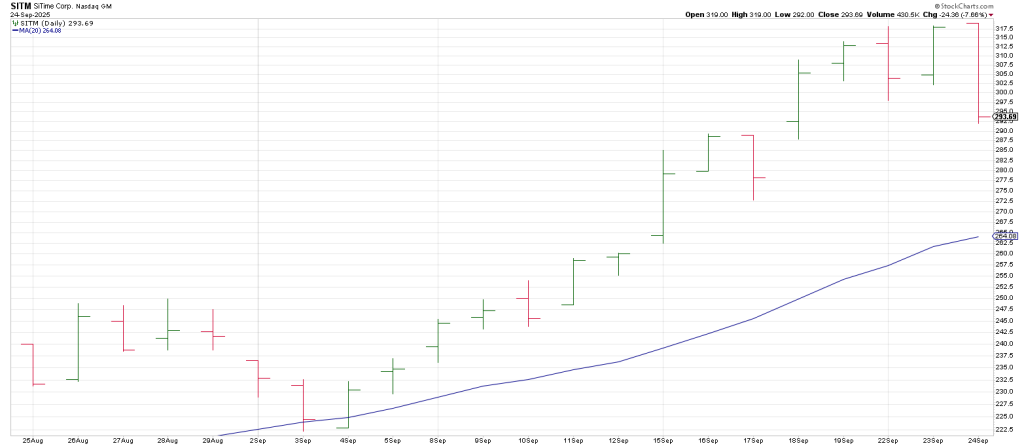
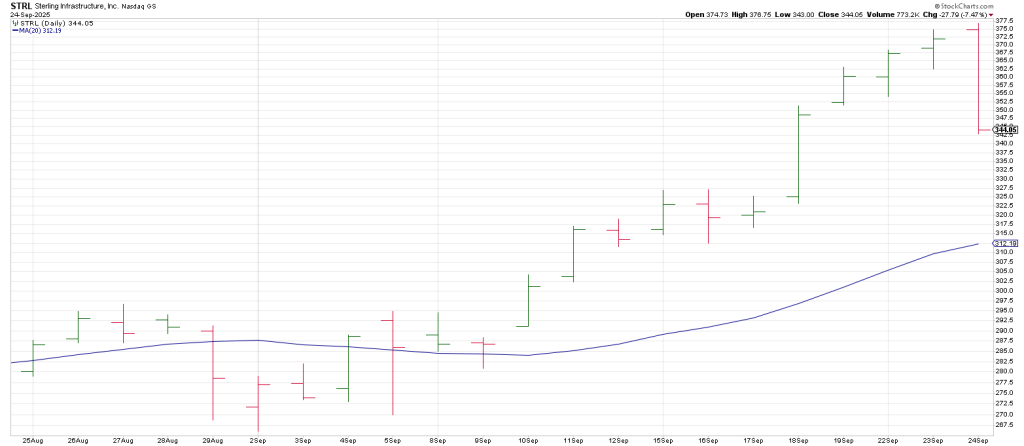
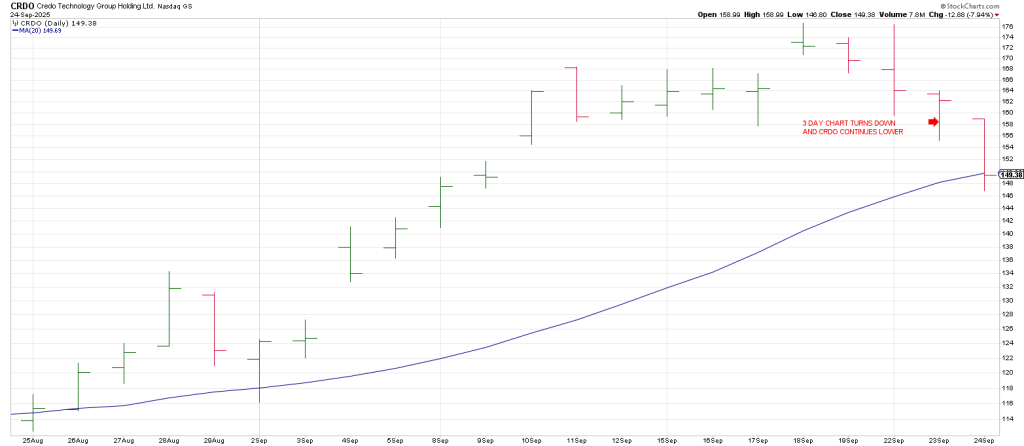
These are some of the biggest winners of the quarter.
And as if in a Broadway play they were all taken to the woodshed in the on Tuesday/Wednesday.
Just coincidence I’m sure.
There are a lotta folks that were ambushed who are trapped.
These names and others may suffer into quarter-end.
Be that as it may the market was at a potential turning point on September 22/23
As described in this space last week.
Why?
We have been showing the similarities between the structure and cycles of this blow-off and the 1929 crescendo.
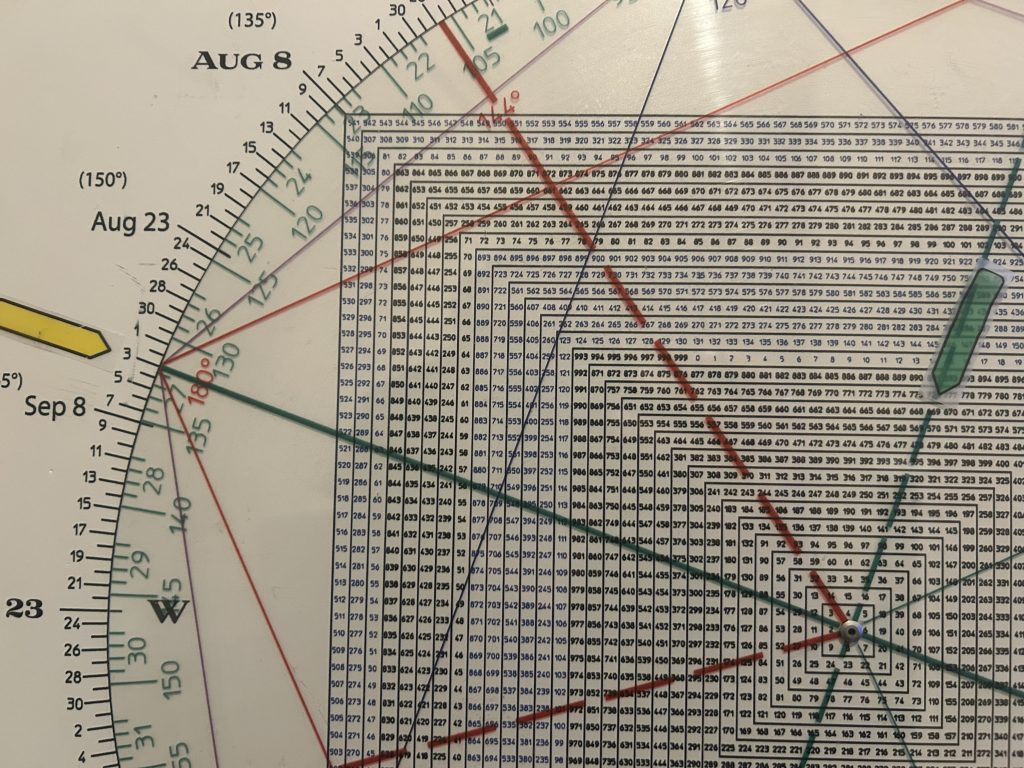
At the end of the day there is nothing but Time and Price.
1929 is 96 years ago.
On the Square of 9 Wheel 96 squares-out with September 23.
669 (6699 SPX) was the high Monday/Tuesday and 669 squares September 3—the high in 1929.
From a low of 135 in March 1926, the DJIA peaked at 386 three years (3 years and 5 months to be exact).
On the Square of 9, 396 is 4 revs of 360 degrees up from 135.
1440 degrees.
The last ditch run in 1929 was 3 months running from May to September 1929.
The current runaway move has run from April into September…so far.
The DJIA is currently up three years from the October 2022 low of 28,660.
To work with the Wheel we move the decimal point getting 287.
720 degrees up is 438 or 43,800..
A 90 degree Throw Over is 460 or 46,000.
The DJIA all time high here in September is 46,700.
Above 46,700 opens the door to 482 or 48,200.
482 is 180 degrees straight across and opposite the mid-November time-frame.
A potentially very important time frame aligned with some historic panics as we showed earlier this week.
In sum, the SPX has two consecutive daily lower lows.
A lower low (not necessarily a lower CLOSE) will turn the 3 Day Chart down.
The 3 Day Chart and the 3 Week Chart is one of the ways we determine the trend.
Since the April 7, 2025 low, the SPX has turned its 3 Day Chart down only 5 times.
May 7
May 23
June 20
July 31
August 20
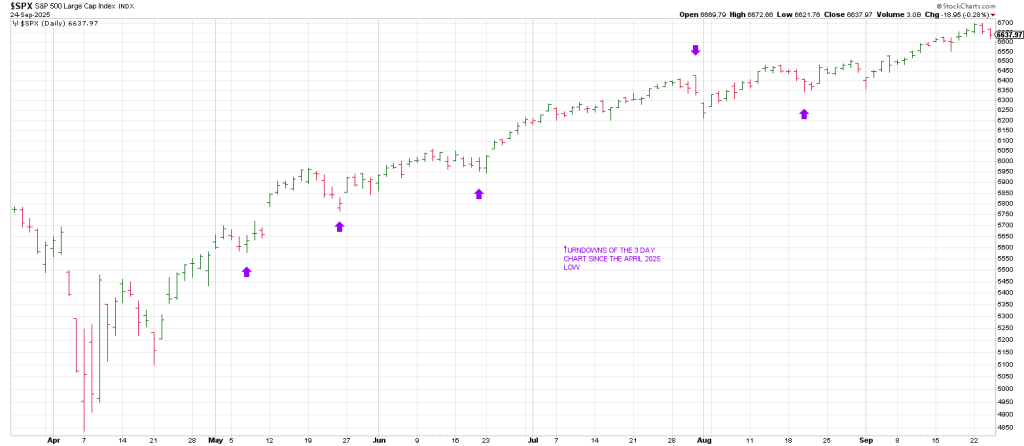
Each instance (within 1 day) defined a low where the rally spurted ahead again.
On Wednesday the SPX has two consecutive lower daily lows.
Trade below Wednesday’s low of 6621.76 by even one tick will turn the 3 Day Chart again.
This is likely to occur because 90 degrees down from the all-time high is 6613..not far below Wednesday’s close.
Given the angle of attack to the downside, the strong likelihood is 6613 gets tested.
The T Rex in the ointment is that it may not happened today—turning the 3 Day Chart down.
If the 3 Day Chart turns down the subsequent behavior will be critical to observe.
The Square of 9 Wheel is available at cooperhitandruntrading.com
Grab a free ebook on the site that explains how to use it.
The Wheel is currently offered at a discount…$300 instead of $375 through the end of September
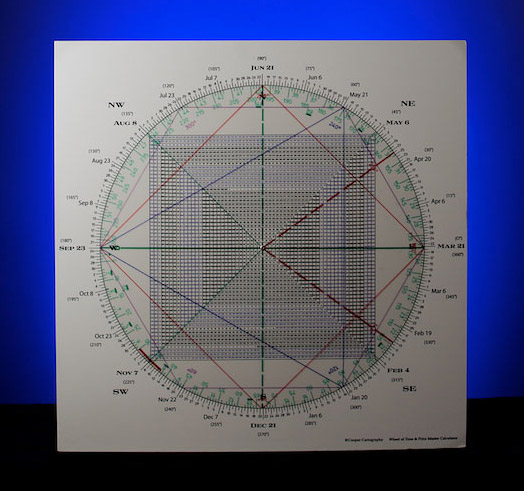
Use coupon code SQUARE75 at checkout