“One of the important factors behind the fluctuation between full and bear markets, between booms and crashes and bubbles, is that investor memory has to fail us—and fail universally—in order for the extremes to be reached.” Howard Marks
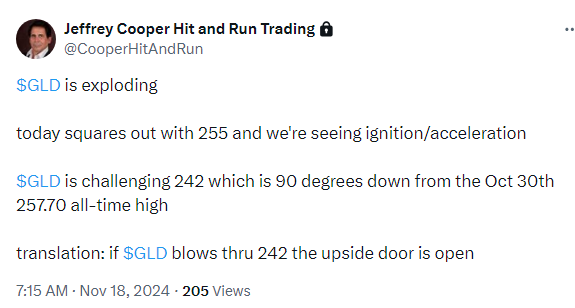
Monday the action was in the precious metals.
Gold was up $48 or 1.87%
Silver was up $0.94 or 3.10%
The stocks
The Square of 9 Wheel did a fantastic job of pointing the path to profits and alerting us to risk in GLD at the 255 region— OVER A YEAR before it got there.

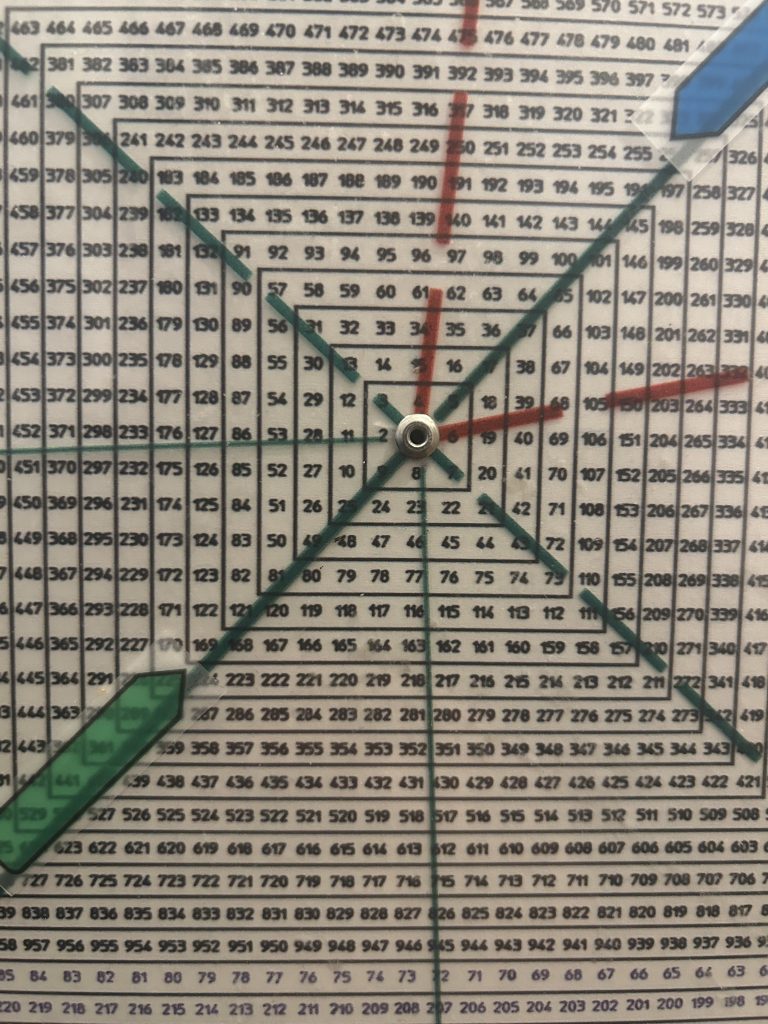
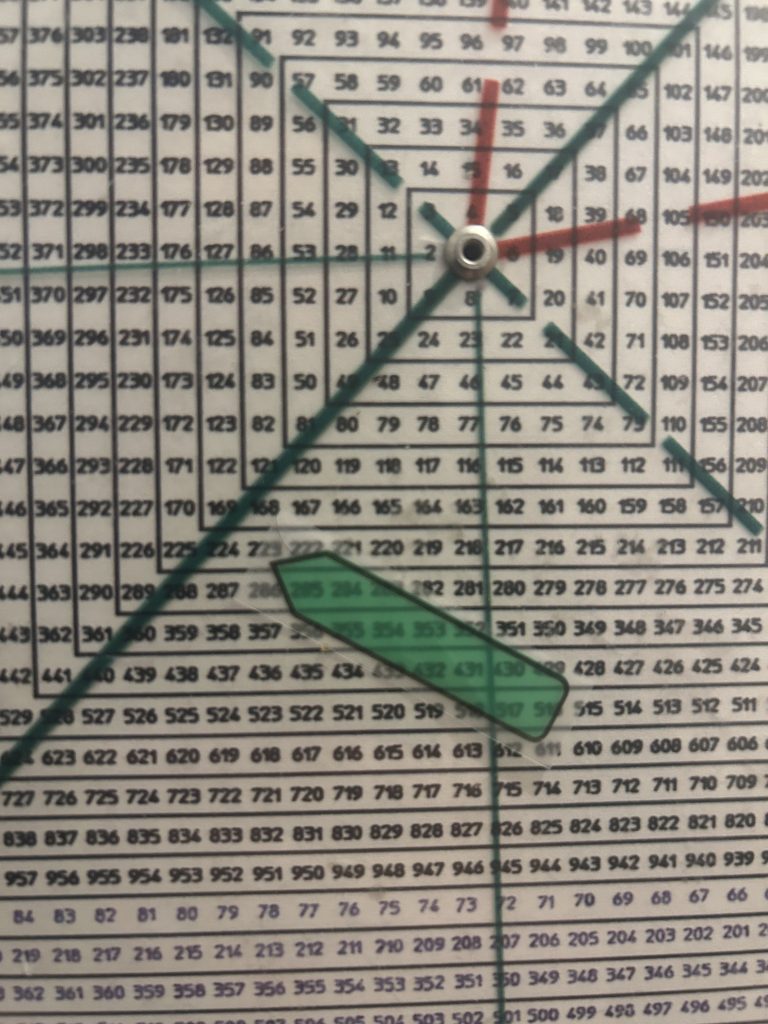
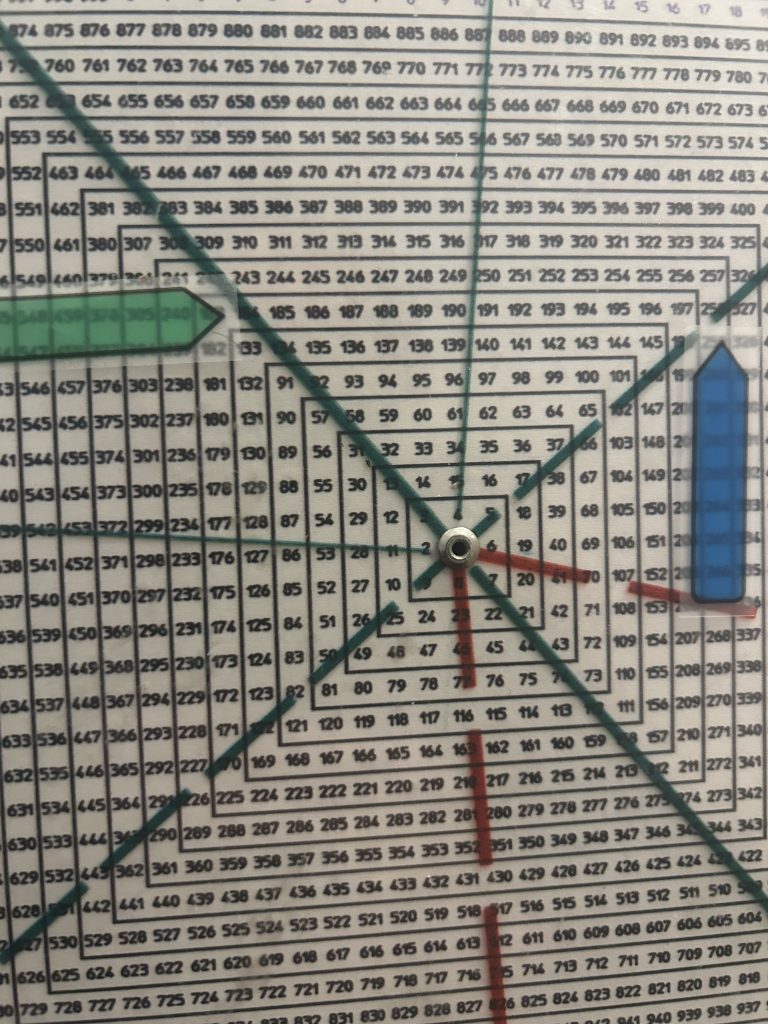
Square of 9 Wheel
Purchase your own Square of 9 Wheel. Shipping to US only. Contact Jeff for shipping outside the US.
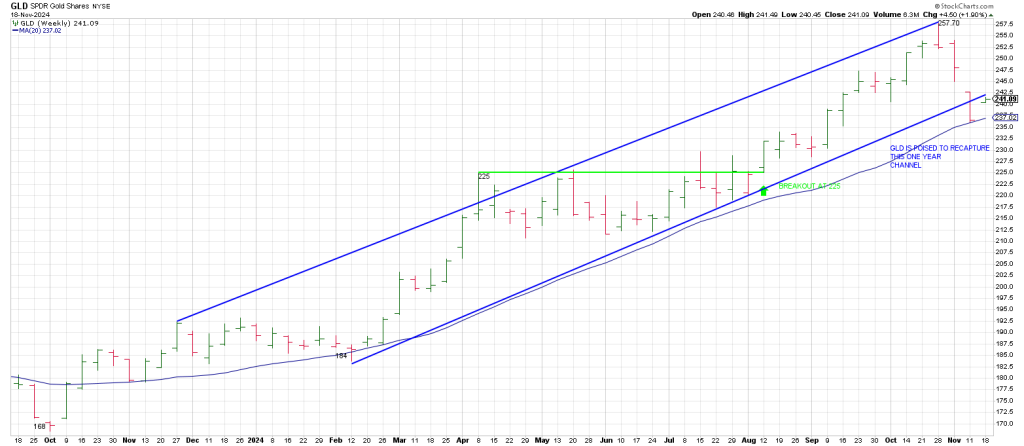
To recap, from the early October 2023 low of 168 a 540 degree (cube) advance is 255.
GLD pushed for 2 days over 255 at the end of October then dropped with authority on October 31st leaving a 2 day Island Top.
360 degrees up from that 168 low is 224.
GLD exploded from a low of 184 in February to 225…basically aligning with the aforesaid 224 square-out.
That ramp to 224-225 saw GLD consolidate for 17 weeks before triggering a Rule Of 4 Breakout (a breakout over triple tops) on the week of August 12th.
184 squares-out with 258 (258 is 360 + 90 degrees up from 184).
That gives us a trifecta of square-outs at 255 to 258.
In the last week of October this confluence exerted its downside influence: GLD left a weekly Topping Tail.
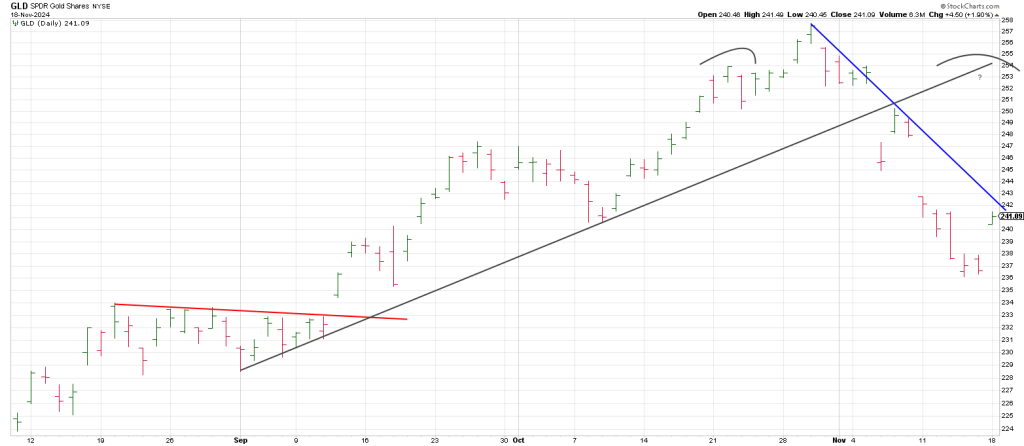
It followed through hard to the downside over the last two weeks dropping to 236 last Thursday.
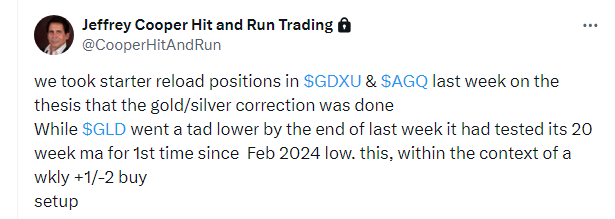
Last week members took pilot/starter positions in the metals alerted on the Hit and Run Private Twitter/X Feed.
Why?
Because GLD tested its 20 week moving average and last Friday/ and yesterday, Monday squared out with the 255 top region.
Monday’s up-gap is challenging a declining trend line from high.
Upside follow thru targets the 50 day line. Above that opens the door to 248.
The last breakout in GLD was on September 12th, 90 days/degrees out is December 12th.
This is roughly 180 days/degrees from the June 12th low.
The second week of December should be a turning point.
Dec 12 is opposite the low 250 region which ties to a Ghost Line (grey in the above daily GLD).
That is the upside pivot above which opens door to new record highs.
This is the Hit and Run Methodology…integrating Time, Price and Pattern.
It allowed us to collect a super 28 points overnight on the balance of our TSLA long.
It gave us a 11 point gain on LULU short on Monday.
It delivered 4 points intraday in CRUS.
Everyday we play both sides of the market.
These are the closed positions on Monday.
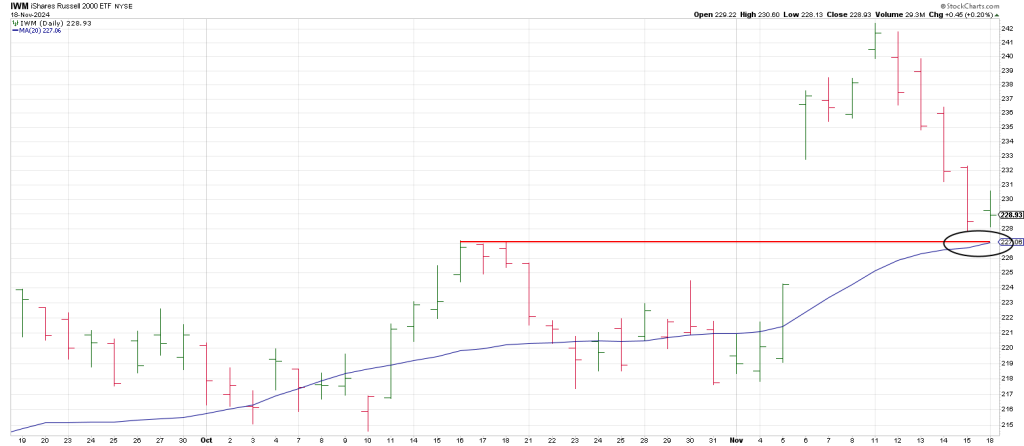
In sum, The Truth Teller, IWM, is at the Do or Die, point.
It has pulled back to its October high and its rising 20 day moving average into Phil D Gap.
Notably its 3 Day Chart turned down directly off a 52 week high last Thursday and IWM continued lower.
Likewise the SPX is testing its October highs and its 20 day moving average after carving out a 6 day Island top with Friday’s large gap down.
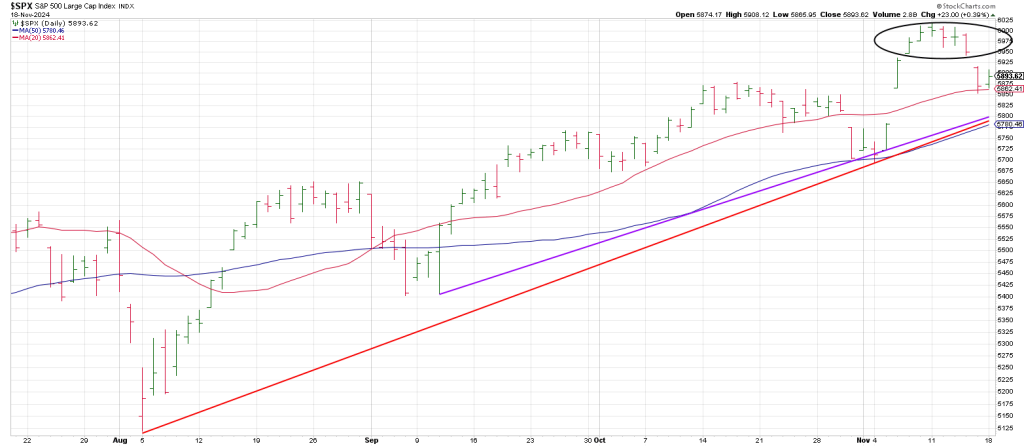
Bearishly instead of generating upside traction on this test, the SPX is gapping down again this morning.
Breakage below the Trump Gap at 5782 in tandem with a failure below a trend line from the August low warrants caution.
Wall Street posted its worst weekly performance since the start of September.
It has now produced a negative week in three of the last four.
This after closing above 6,000 for the first time ever on November 11th.
The 6001 close was a lone close over the milestone and by one point.
Now markets are flirting with breakage below prior swing highs, smacking of a false breakout.
The Bear has been poked.