“Astrology is important, math is more important.” W.D. Gann
“Mathematical science, which is the only real science that the entire civilized world has agreed upon, furnishes UNMISTAKEABLE PROOF of history repeating itself and shows that the cycle theory or harmonic analysis, is the ONLY thing that we can rely upon to ascertain the future. W.D. Gann
“And when Monday comes round there’s a high, lonesome sound.” King of the Hill, Roger McGuinn
By now all of the members to our Hit and Run report believe it is possible to see that Time, Price and Pattern come together in a dramatically overbought market both technically and sentiment-wise that is possible to prepare for and then capture, huge gains as the sell -off starts.
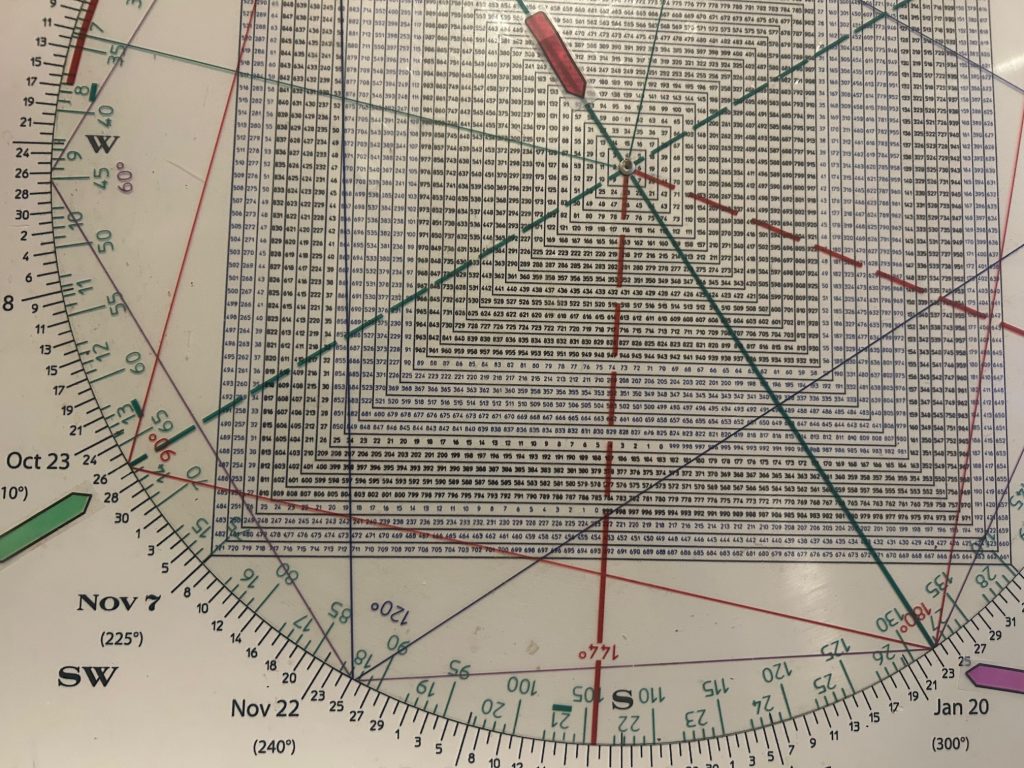
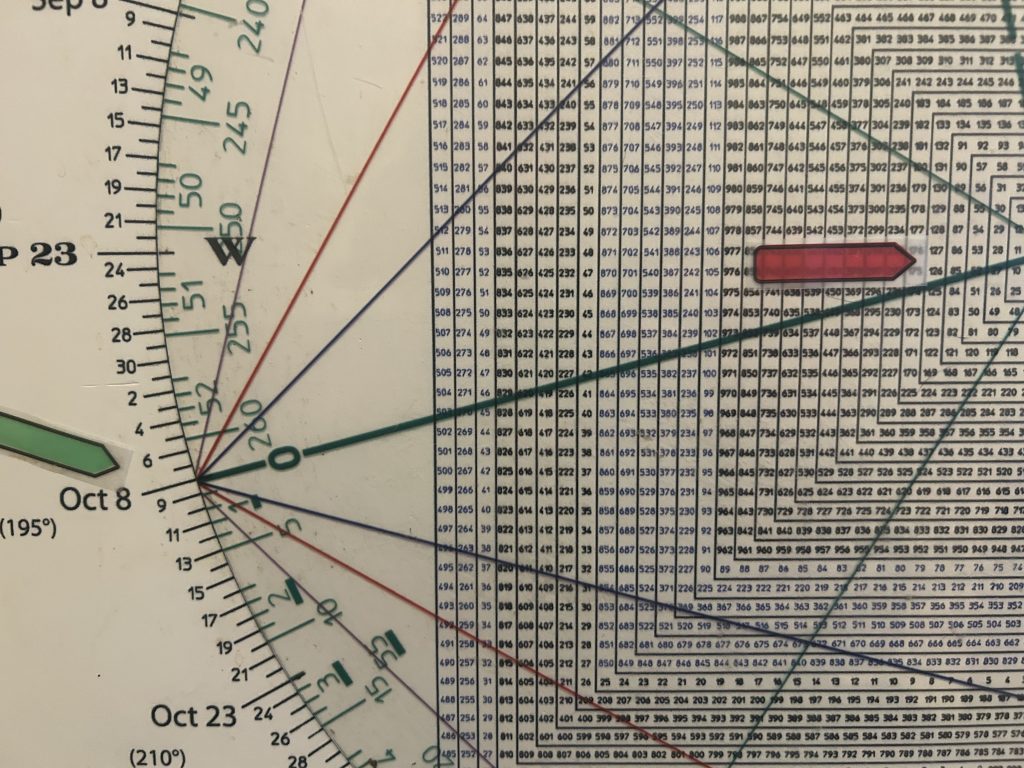
There is ONE tool that allows you to integrate Time and Price and see when they balance out/square-out—The Square of 9 Time & Price Calculator (The Gann Wheel).

The Wheel has been around for thousands of years in Egypt and India.
W.D. Gann traveled to both countries to investigate it.
Obviously the Wheel was not being used to trade 2,000 years ago in Egypt and India.
My believe is it was used as an astrological tool.
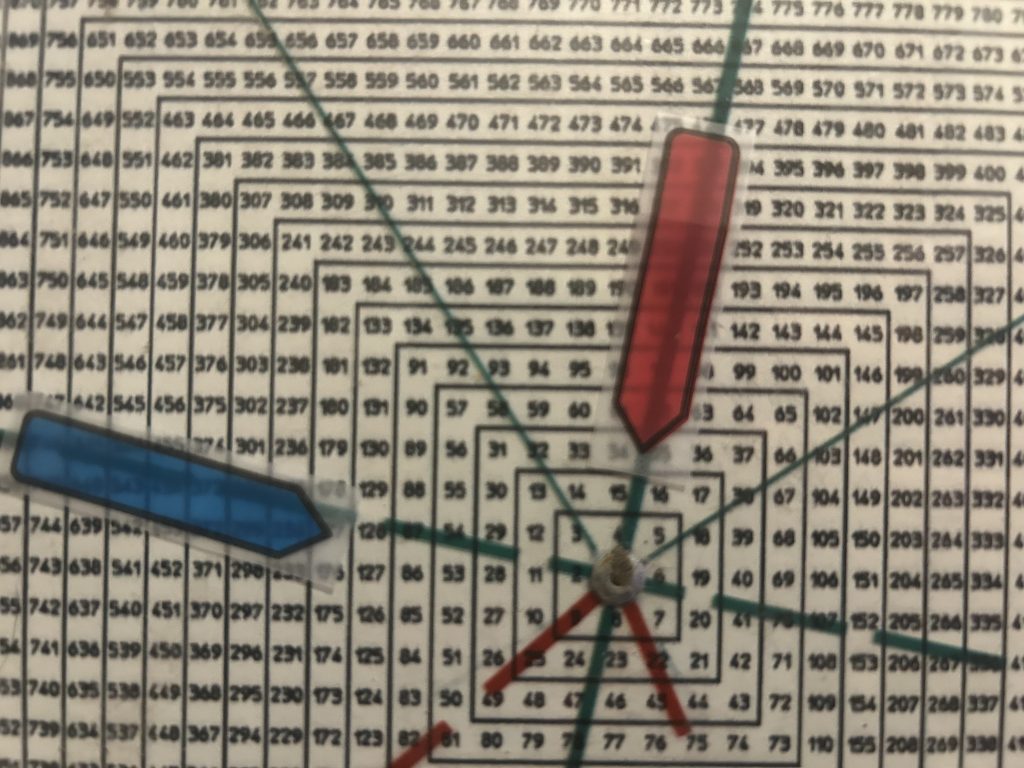
Interestingly, the Square of 9 is a birds eye view of the Great Pyramid of Gza.
The center of the number grid is the apex of the pyramid with the numbers spiraling down and around like the steps that lead to the top of the pyramid.
The ancients were integrating Time with ones Age (price) in keeping with Gann’s Law of Vibration.
In early 2025 we noted that there was a strong likely hood that a mirror-image foldback to 1929 would play out. Indeed last QQQ high struck on October 29, the time-frame of the Great Crash in 1929.
This is because the historic low following the 1929 crash occurred in 1932.
93 years from 1932 is 2025.
On the Square of 9 the number 93 squares-out with the end of October..
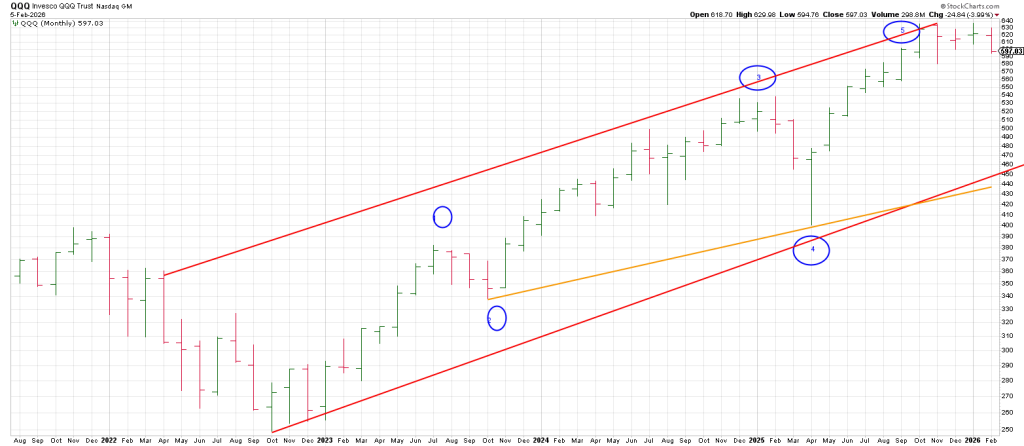
I am not an expert in Elliott Wave Theory, but I have seen demonstrated that a major 5 wave structure of a Super Cycle advance could be considered complete in 2025/2026.
Checking a monthly QQQ from the important 2022 LOW shows 5 conspicuous waves up.
The Monthly Swing Chart turned down Wednesday on trade below the January low and bearishly the Q’s extended yesterday.
Further downside confirms that an important top is behind us an impulsive 5 waves down on the smaller time frame is a blaring siren of a major top having been struck.
Consequently, counting from the last Super Cycle low in 1932 shows that 93 years later in 2025 points to late October when the 1929 crash occurred.
High points to low, low points to high.
Notice that time of crash in late October 1929 squares-out with the price of the DJIA high in 1929.
The high was 386, the closing high was 381.
Uncannily, the Square of 9 Wheel “splits the difference””.
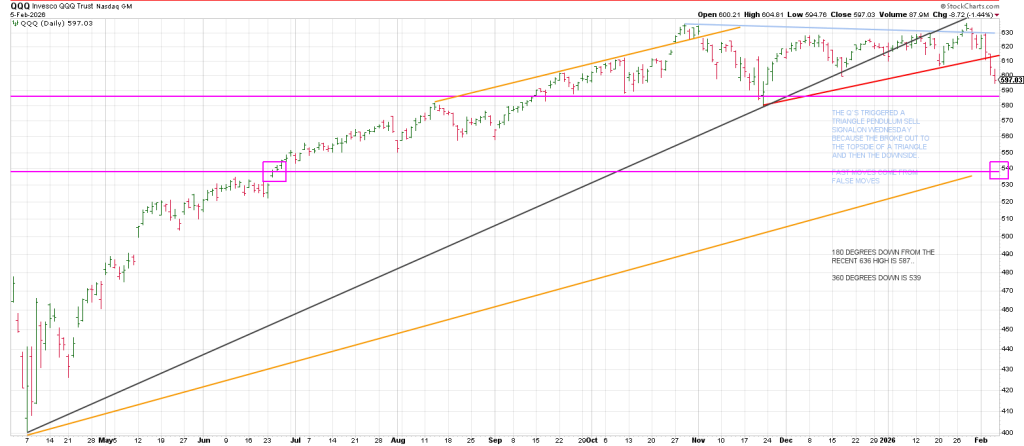
Last year the Q’s struck a high of 637 on precisely October 29th.
90 geometrical days/degrees later the Q’s broke-out of a SEVEN week trading range, kissing/backtesting a trend line or what I call a Ghost Line from the April 2025 low and rolled over leaving a Gilligan sell signal (a gap to a new 60 day high with a close at/near session lows).
Time, Price and Pattern.
The end of January is straight across and opposite the DJIA high in 1929 and the number 93.
The October high was 92 years square the 1929 crash and the primary high in 2025.
The January 2026 high is straight across and opposite the price high in 1929 and vibrates off 93…being the number of years from the Super Cycle low in 1932.
“After exhaustive research and investigations of the known sciences, I discovered that the Law of Vibration enabled me to accurately determine the exact points to which stocks or commodities should rise and fall within a given time. The working out of this law determines the cause and predicts the effect long before the Street is aware of either.”
Consequently we wrote a report last month simply titled, February 2026 showing the reasons for our expectation that markets would turn down in February.
Is it happenstance that the Q’s and the SPX struck a high 90 days/degrees from their October high and turned down with authority?
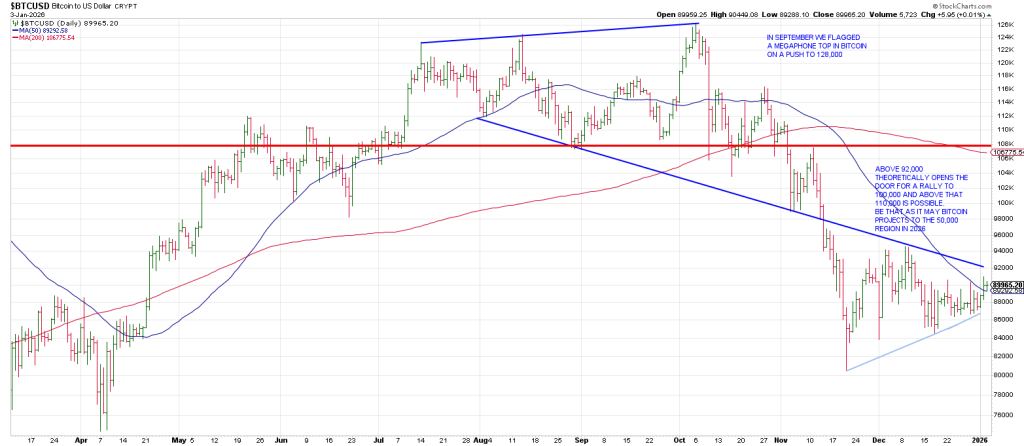
Turning to bitcoin, last September we showed a chart of bitcoins Megaphone Top stating we didn’t just expect a correction but to expect “Hiroshima”.
We showed a chart with bitcoins Megaphone Top again in yesterday’s piece.
Below is a weekly bitcoin from 2020 showing the important October 2022 low.
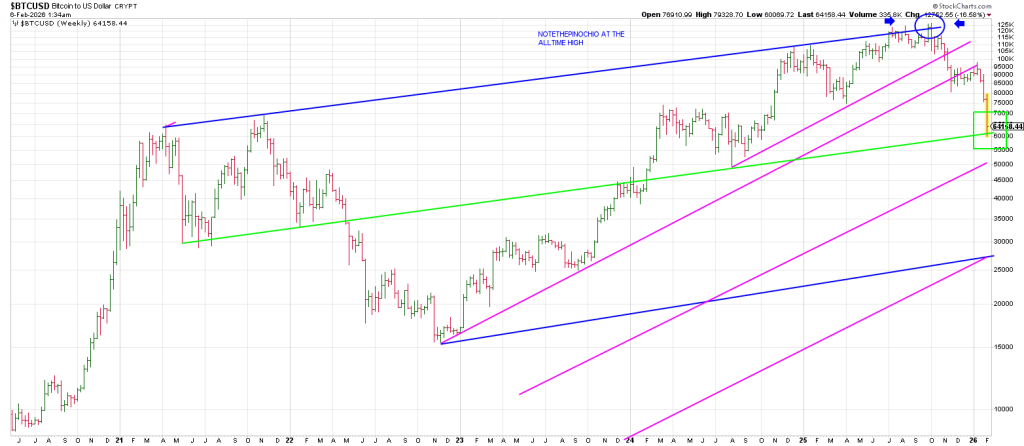
On the Square of 9 Wheel early October squares out with the 125-128 range, last October’s all-time high.
Rime points to price, price points to time.
The 15,000/16,000 low from October 2022 points to 128,000.
I drew a line connecting the 2021 double tops to the late 2024 peak.
Notice how the final high last fall Pinocchio’d The Line.
Principle One: Fast moves come from false moves.
Mr. Market is driving Miss Direction.
Bitcoin confirmed a Megaphone Top when it broke the upper magenta line last November dropping to a parallel Bottoms Line from the October 2022 bottom where it carved out a Bear Flag formed 360 degrees down from the 128,000 top.
Two weeks ago bitcoin accelerated to the downside dropping below our 70,000 projection made just a few months ago.
While the door is open for a drop into the 27,000 region.
27,000 is the intersection of the bottom of the blue trend channel and the bottom of a magenta line that parallels key price leels.
It is worth noting that bitcoin has declined to an important trend line/Ghost Line. This is the green line connecting several key lows over the last several years.
Notice that this green trend line parallels the blue trend channel underscoring its potential significance.
Consequently Hit and run sold its bitcoin puts for a 10-bagger.
We still have a short in IBIT.
65,000 squares today in bitcoin.
In sum, it may take a little getting used to working with integrating Time and Price through the Square of 9 Wheel but the effort is worth a fortune.
A strong work ethic is the key to being a successful trader.
Some of my golden principles of successful speculation.
1)Most of Wall Street follow price. The old adage being that price is the only thing that pays.
However, as Gann stated, “Time is more important than price”.
TIME TURNS TREND.
2) The stock market moves in patterns and cycles. Past price patterns repeat themselves.
Integrating these patterns into Time and Price harmonics you can determine the trend and forecast the likely outcome.
3) A momentum move doesn’t just stop. It takes time to roll over.
4) Markets can turn on a dime, most traders cannot.
5) Volatility precedes price.
6) As my dad liked to say, “Markets don’t move, they are moved.”
7) Beating the market is very possible by limiting drawdowns, with focus, perseverance and disciple. In sum, it may sound trite, but when it doubt, get out. Never confuse your position with your best interest.