“Put your hands on the wheel
Let the golden age begin
Let the window down
Feel the moonlight on your skin.” The Golden Age, Beck
In markets they say Price is King.
To be sure, Price is the point of the speculative sword.
But no one escapes Time. Including Price.
A king is regarded as the most important in his realm.
However, when it comes to market analysis, price action is not the key determinant.
Let’s look at ancient mythology.
Zeus was King of the Gods. However, Cronus is the father of Zeus.
The Greek word for time is Chronos…where we get the word chronology.
Interestingly, the father of Cronus was Uranus.
We’ll get to that in a later report this week.
Suffice to say it’s critical to where the market is here in 2024.
In sum as legendary trader, W.D. Gann stated, “Time is more important than Price.”
What did he mean by that?
Yesterday’s report used the following Gann quote reflecting his belief that Time Turns Trend:
“Tops usually take time to form. Spike tops are less common compared to spike bottoms.
Divergences will appear at the top but they cannot be used for TIMING THE TRADE.
Time cycles shall indicate when the actual reversal will start.” W. D. Gann
Mark Twain expressed it this way.
“By the law of periodical repetition, everything which has happened once must happen again and again—and not capriciously, but at REGULAR (my caps) periods, and each thing in its own period, not another’s and each obeying its own law.” Mark Twain.
Gann couldn’t have said it better himself.
Gann’s trading methods put a great deal of emphasis on anniversary dates.
His December 1928 forecast for “panicky selling in the fall (of 1929)” was largely based on a Black Friday panic in 1869.
While it may seem that price action is the key determinant, in reality it is the patterns woven when price is integrated with time that is the Truth of the Tape.
As I often say, the news breaks with the cycles, not the other way around.
Tweaking that, Price breaks with the cycles, not the other way around.
Although it may seem at times that price is moving randomly within a market, there is always a mathematical relationship in one move to another when cycles exert their influence.
As Gann wrote, “When Time and Price square-out, expect a change in trend.”
Squaring out means balancing out time and price. At these convergences they become one in the same.
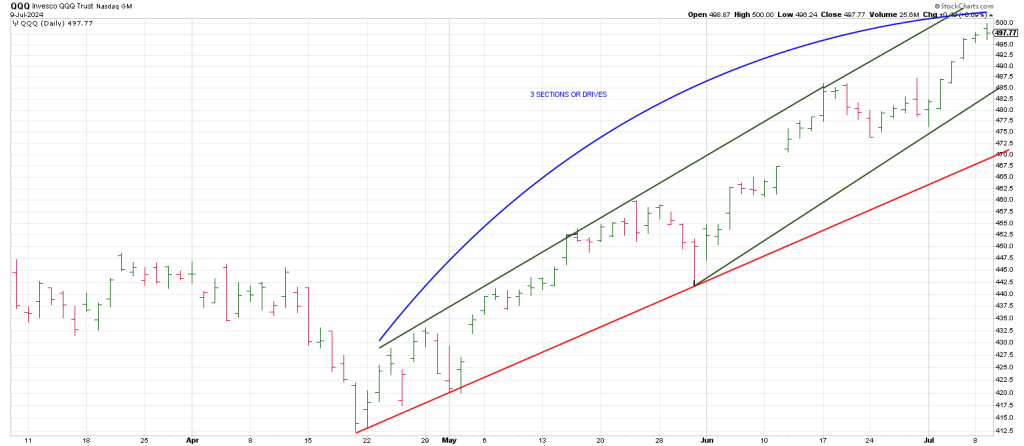
From JULY 2023 to October 2023 the weekly SPX declined in 3 sections in 90 days/degrees.
90 degrees being a “square-out”, a right angle.
From the April 19, 2024 low to mid-July 2024, the weekly SPX is advancing in 3 sections into 90 days/degrees.
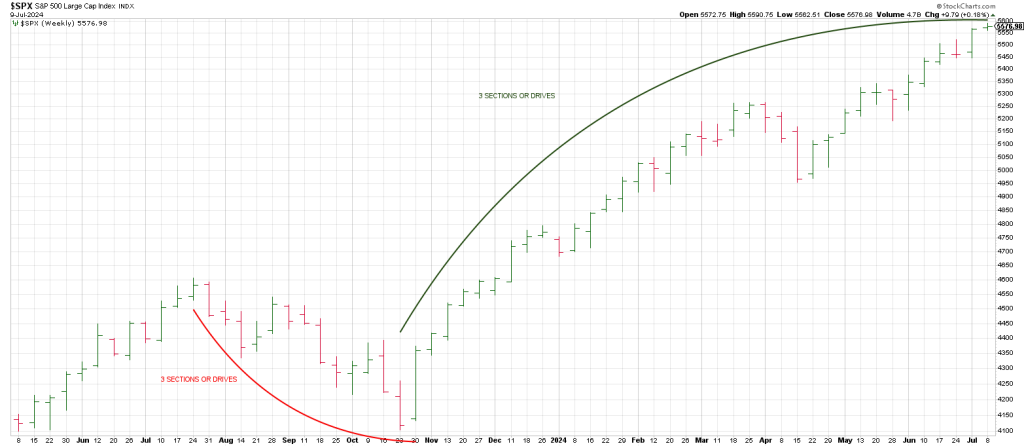
This is one way time and price can balance out. The outcome is to be determined.
But clearly the market has been in a vertical run since October 2023.
Does this persistent 9 months/ 270 degree/day drive higher from October 2023 ‘correspond’ to anything that comes to mind?
Well, the slow-motion train wreck from January 2022 to October 2022 was also 9 months.

The runaway advance since Oct 2023 is a mirror image foldback to the slow-motion train wreck in 2022.
There are other ways to integrate time and price.
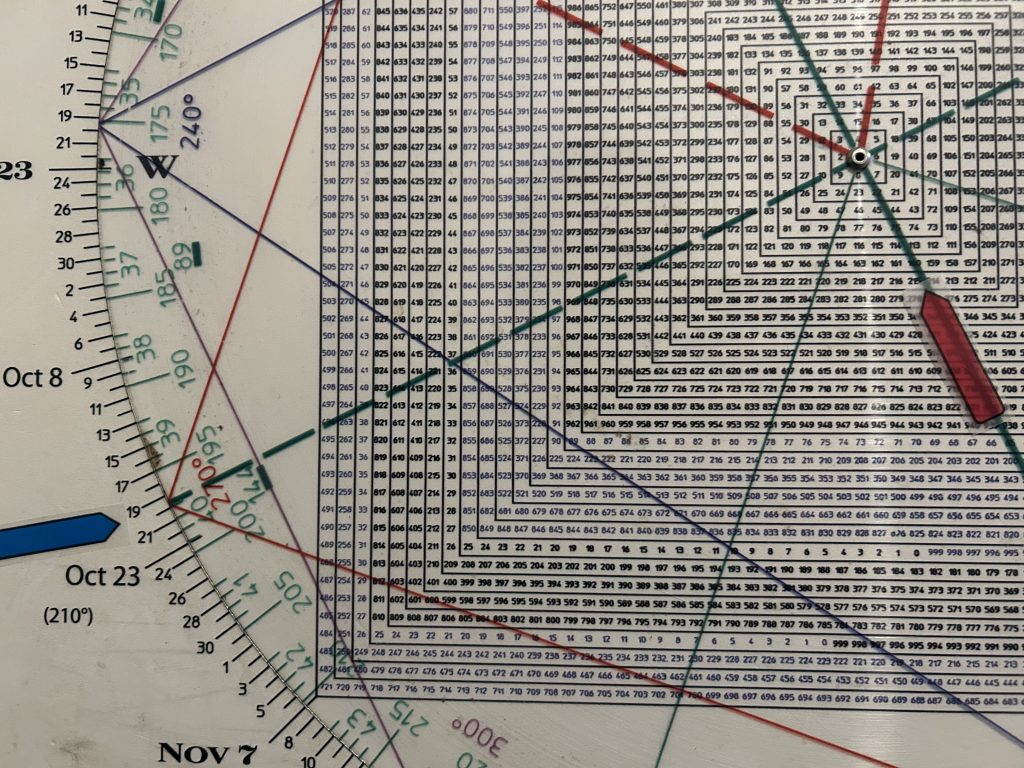
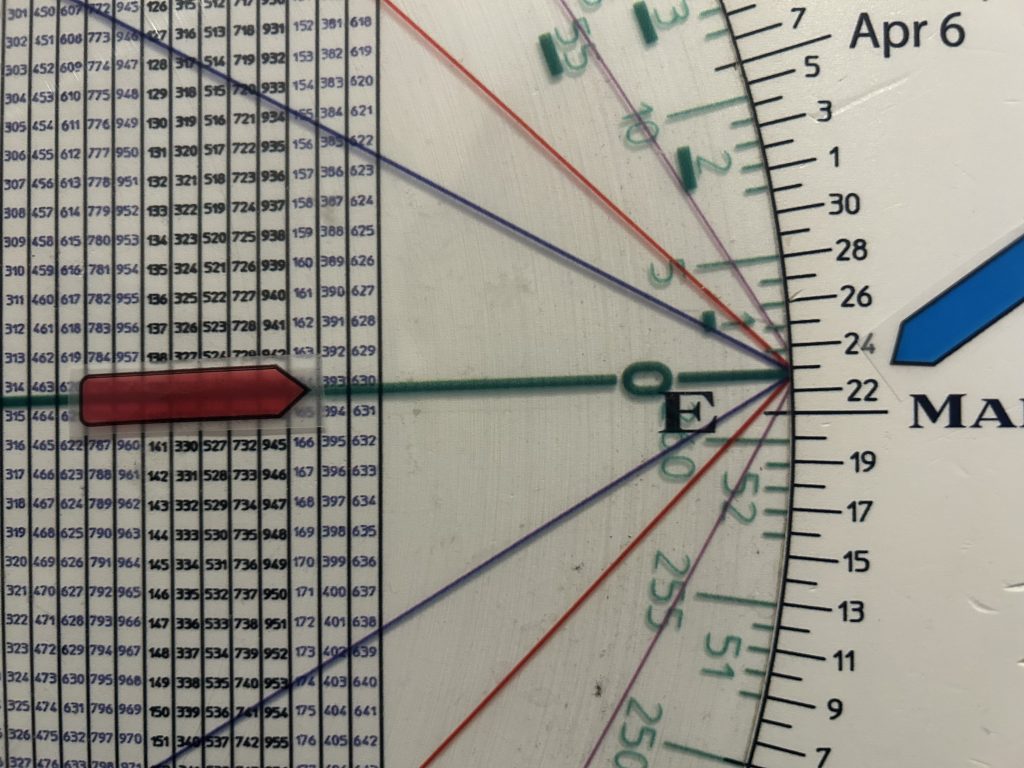
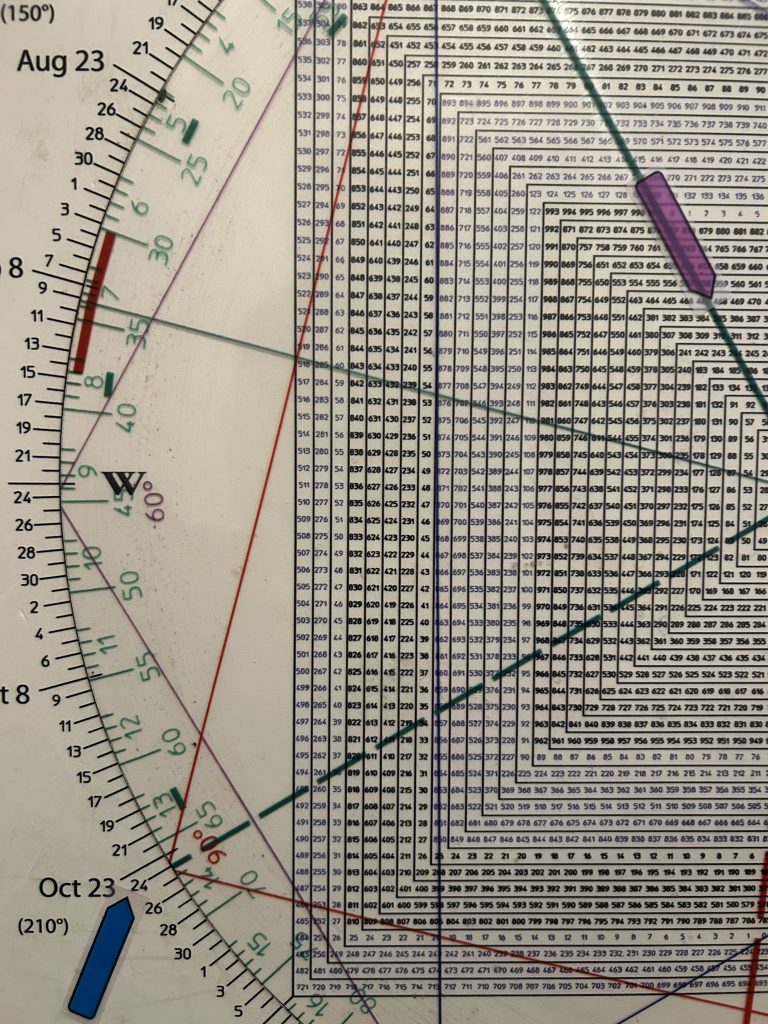
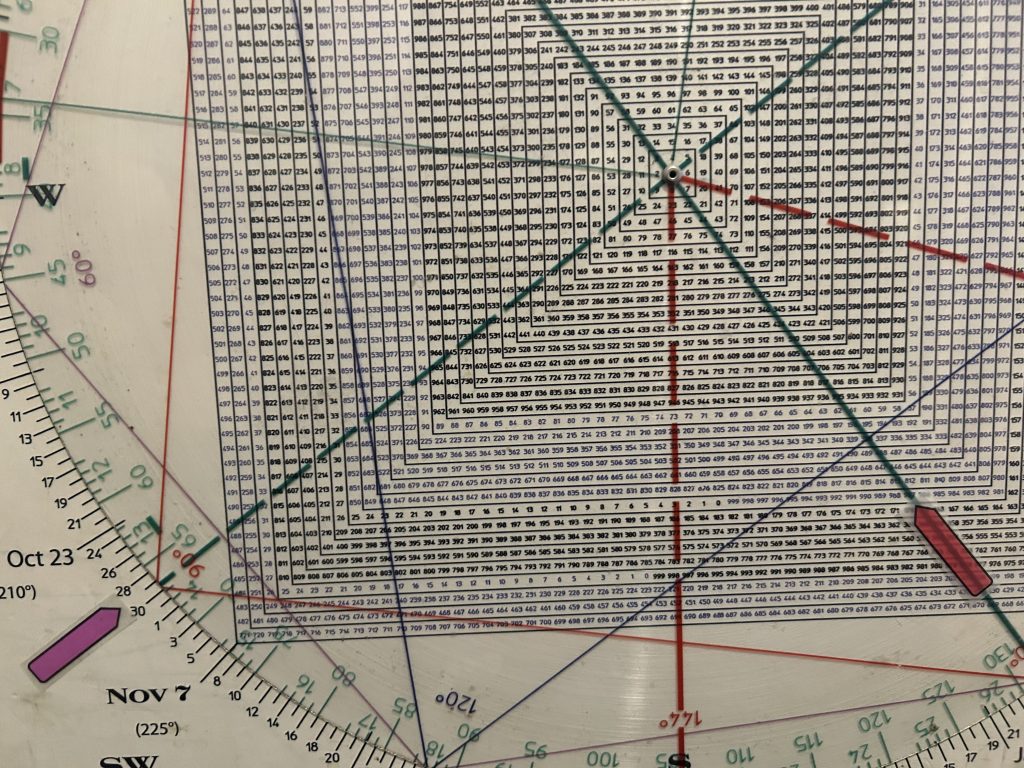
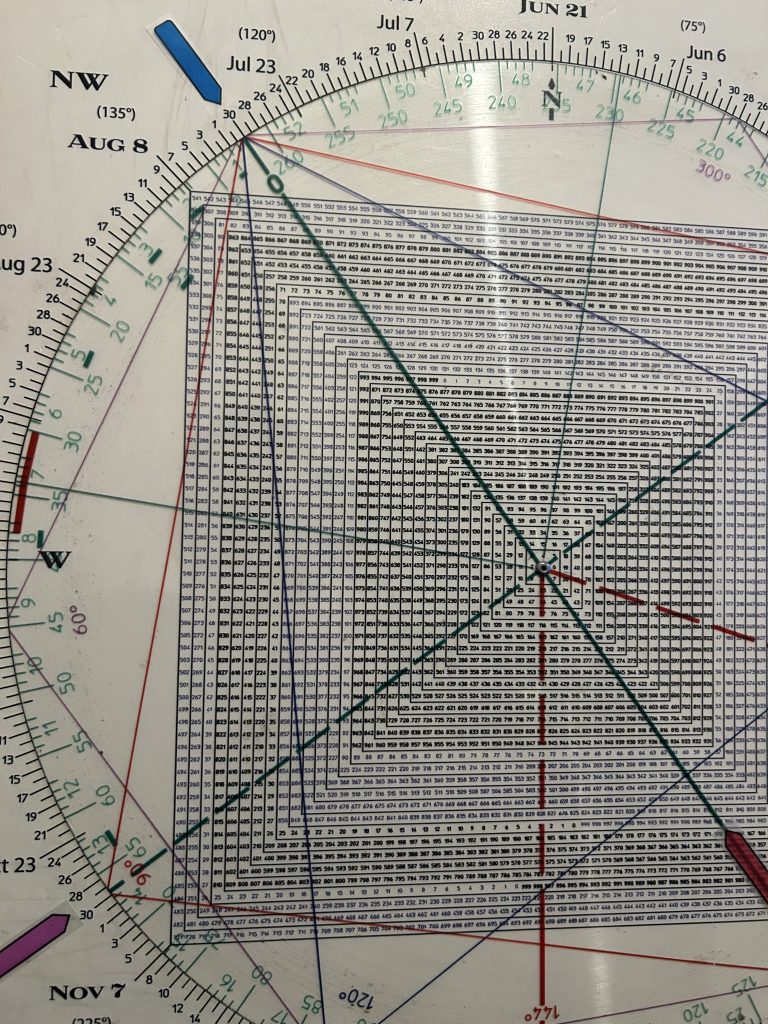
You can do so by using a tool called the Square of 9 Wheel or Time/Price Calculator.
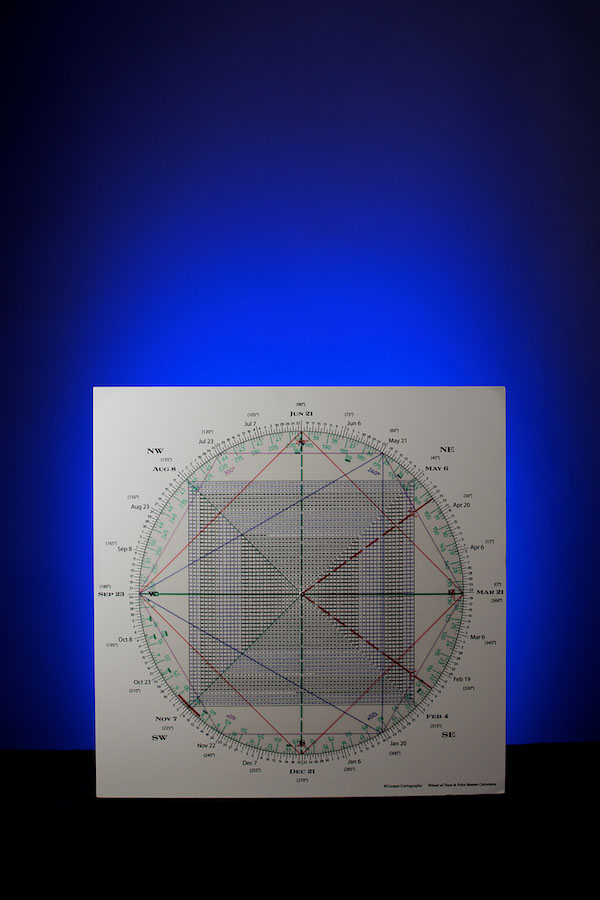
The Square of 9 Wheel can measure price independently in its 90 degree octaves or moves, or, it can measure price independently in its geometric progressions.
But the truly unique nature of the Square of 9 Wheel is that it can integrate Time and Price.
When the two dovetail it often points to an important, sometimes major turning point.
Let’s take a look at just a few examples.
The March 6, 2009 SPX bear market low was 666/667.
666/667 squares-out (90 degrees) with March 6th
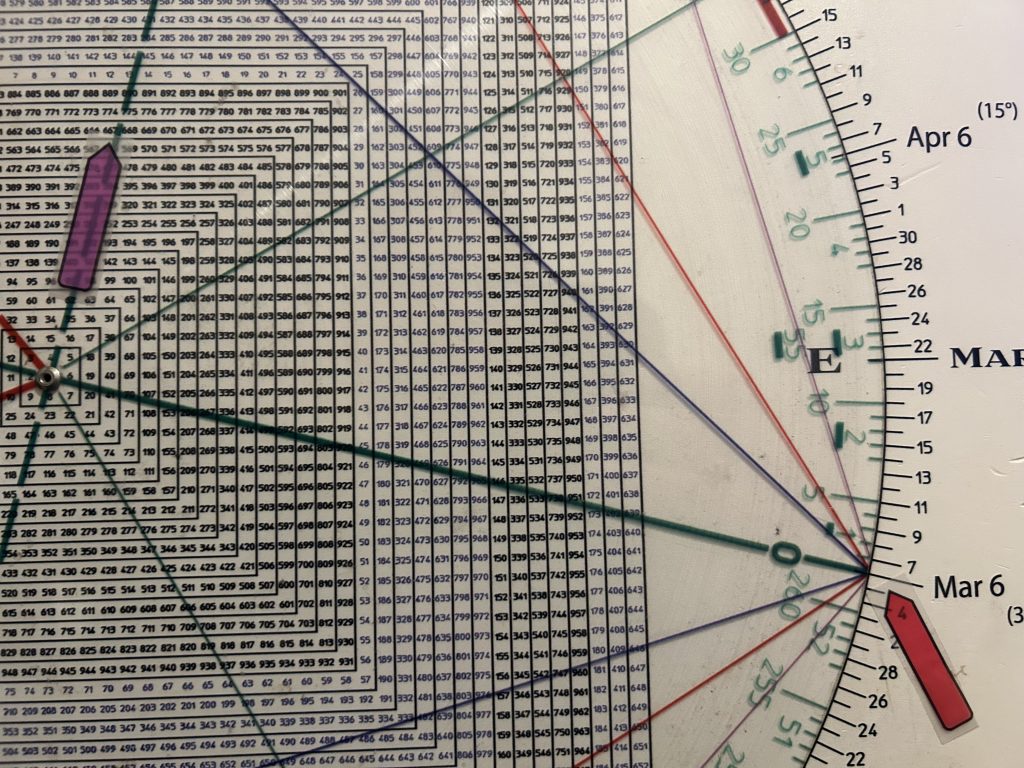
More recently the 349 (3490) SPX Oct 13, 2022 low squares-out with October 13, the low day in 2022.
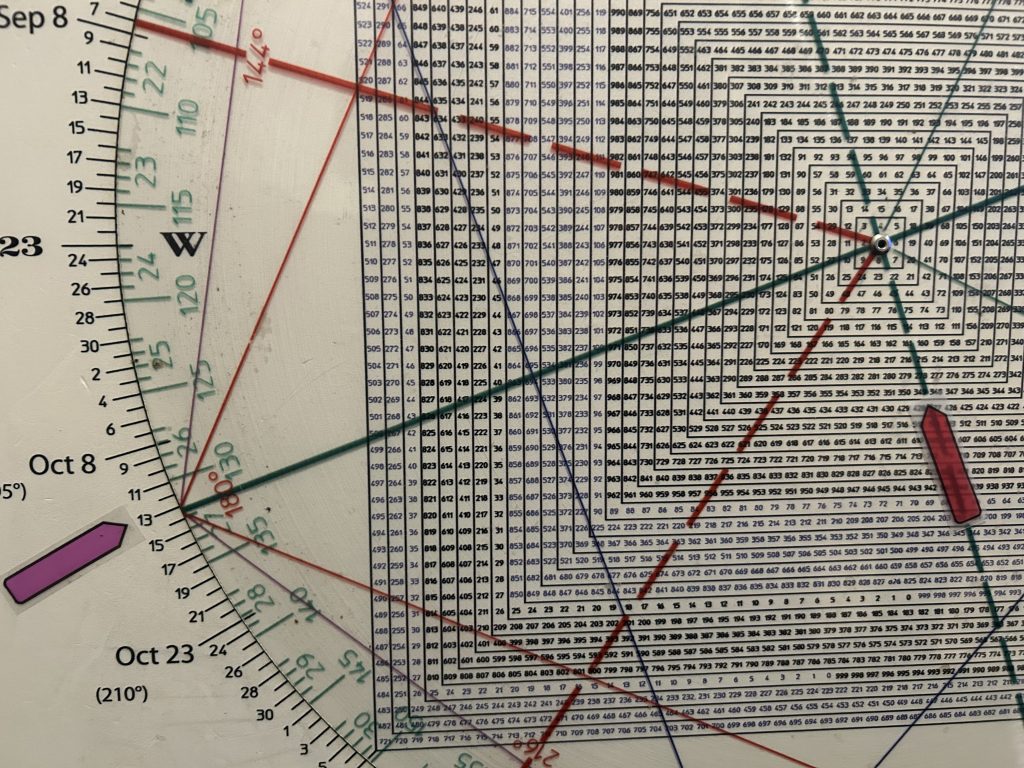
The August 25, 1987 pre-crash high was a square-out.
August 25 is 180 degrees straight across and opposite 339.
The high price scored at the top day on August 25th 1987 was 338.
The Ruling Principle: Time points to Price, Price points to Time.
The phenomena is that Time and Price can predict future levels and dates versus aligning with them at a present turning point.
For example, the 1987 crash low was SPX 216 on October 20th for a Time/Price square-out:
The 216 low is 90 degrees square October 20th.
Another example of the predictive value of the Wheel allowed me to call the exact day of the Covid Crash low on March 23rd, 2020 in these reports.
How?
Because the pre-crash high of the SPX was 3393.
3393 aligns with/vectors March 23rd.
Time and Price are harmonic octaves of each other.
This is what Gann meant by the Law of Vibration.
“The law which I have applied will not only give these long cycles or swings, but the daily and even hourly movements of stocks. By knowing the exact vibrations of each individual stock I am able to determine at what point each will receive support and at what point the greatest resistance is to me met.” W. D. Gann
I do this every day in the Hit and Run Private Twitter Feed with a number of stocks we focus on such as AMD, NVDA, DELL, TSLA, CRM and ORCL.
Any stock “works” with the Wheel. We have used it recently as well on ANF, GDXJ, CAVA, FSLR and DUOL to mention a few.
Did the Wheel warn of the day of the 1929 crash?
The high price of the DJIA in 1929 was 386.
385 squares October 24th.
That was the day the wheels came off.
That was the day that the abyss opened.
W. D. Gann discovered the Square of 9 Wheel when he went to Egypt and India.
The Wheel was around for a few thousand years and obviously they were not using it to trade back then.
They were probably keying off the year and date of people’s birth to project into the future.
That got me to thinking about using the numbers in the number grid as years versus price.
For example, 1987 squares out with October 29th, the Great Crash in 1929, Black Tuesday.
These are the uncanny ways the Square of 9 Wheel tunnels thru time to tell the future.
The trick of the Wheel is that while all important highs and lows are square-outs, not all square-outs are important highs or lows.
That brings us to the current market.
Today the QQQ is to speculation what the DJIA was in 1929.
On Tuesday the Q’s struck a record high of 500. A nice round psychological number.
It reminds me of the DJIA secular bull market top of 1000 in 1966.
Be that as it may, 500 is straight across and opposition September 3rd,
The pre-crash high in 1929.
As well , 498, is 360 degrees up from the April 19th, 2024 low.
So the Q’s have ripped 360 degrees in just about 90 degrees/days.
Conclusion. July is pivotal based on the Wheel and major anniversaries such as the high in July 1990 and July 2007 (Primary Top).
Whether we get a Primary Top now and a sharp break ala 2007 and a return rally is one possible pattern.
August is also pivotal this year just like in 1990 when war cycles exploded.
1) The ‘year’ 2024 squares the anniversary of the start of the greatest bull market in early August 1982.
2) 1982 as well squares early August.
3) Eerily, the Great Depression low was 92 years ago in JULY 1932.
On the Square of 9 Wheel
92 points to the end of July
It is opposition 1987
It squares out with October 29th
Truly a potential T-Square from hell.
The benefit of the Square of 9 Wheel is that it helps to manage risk and project potential reward.
How do you manage risk if you can’t measure risk?
It is available for sale on CooperHitandRunTrading.com