“You should have seen me with the poker man
I had a honey and I bet a grand
Just in the nick of time, I looked at his hand.” Junior’s Farm, Wings
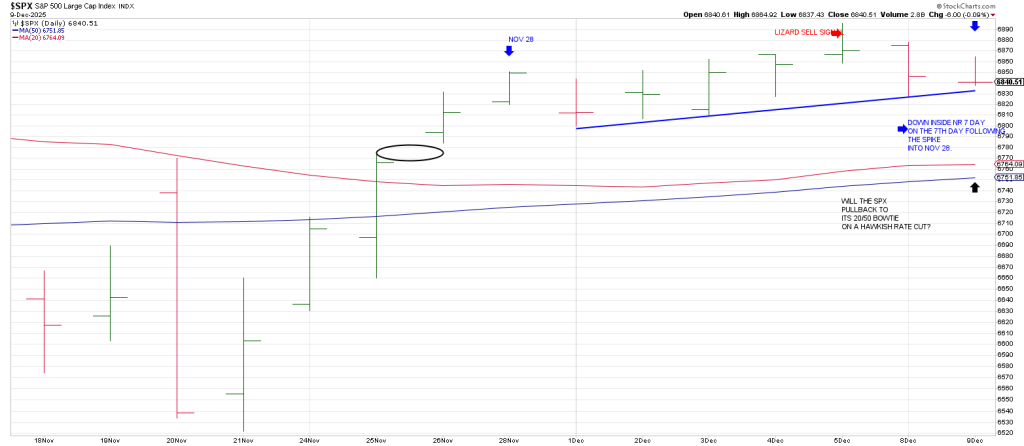
Ahead of today’s FOMC, markets were slow Tuesday as the SPX carved out a down inside NR 7 day—the narrowest range in 7 days.
In fact the SPX has been in a narrow trading band the last 7 days—since the spike into November 28.
Fittingly Tuesday was the 7th day of this narrow trading pattern in front of Fed Day.
The tension on the tape is also reflected by this week squaring out with the 6920 (Oct 29) all time high—692 squares Dec 12.
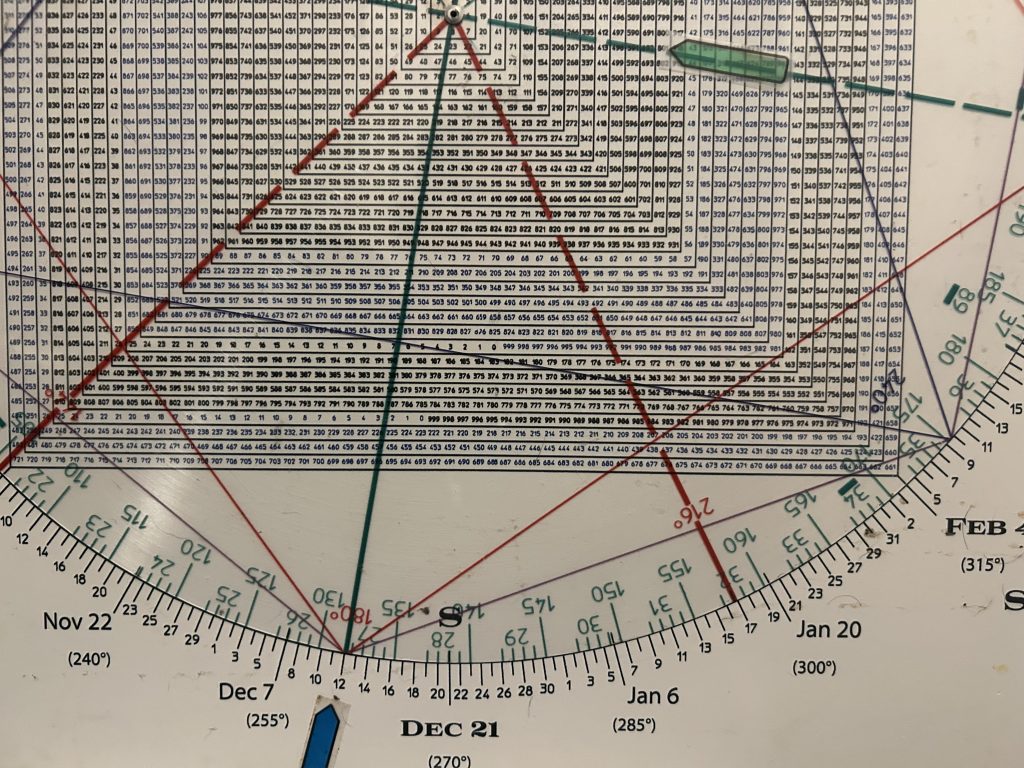
Further we are past 40 calendar days from the October 29 high which in terms of the Gann Panic Window typically represents the final pivot high if the market is going to roll over hard.
Despite Monday’s “bullish” after-hours news that popped NVDA, it closed in the red on Tuesday.
Because markets were for the most part on hold Tuesday, let’s review Monday’s action.
On Monday NYSE net advances finished at -850mkarking the 5th negative reading in the past 6 sessions—a period during which the SPX still managed to gain 23 points.
This type of internal convergence is even more pronounced than the one that preceded the early February Tariff Crash.
It aligns with the persistent drumbeat of bearish signals that have been accumulating in recent weeks.
I can’t help but wonder if a Fed hawkish cut today won’t be the trigger for a downdraft.
That said markets can party when there’s nothing to party about. They could choose to ignore any hawkishness and mirror the 2007 drive into the end of the year.
When the bell rang on 2008 the selling began in earnest and never stopped.
Then, like now, the big players have an agenda to book beefy capital gains in the next year.
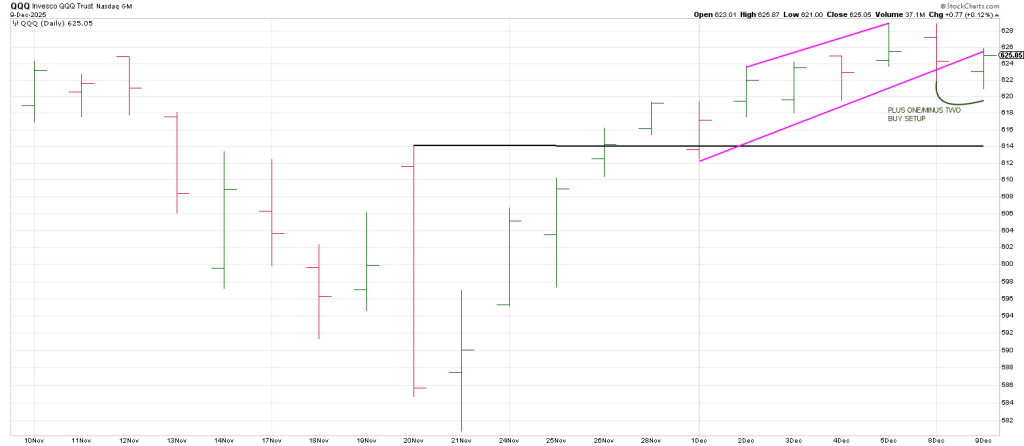
Indeed, the QQQ left a continuation buy setup on Tuesday: it carved out two consecutive lower daily lows since the November 21 low for a Plus One/Minus Two buy signal.
It also registered a “180” buy signal on Tuesday.
This was backstopped by Lockout Rallies in names like COHR, LITE, CVNA, FN and JBL to mention a few.
A notable exception to Tuesday’s “throwaway day” in front of today’s FOMC was the blistering rally in the precious metals and PM miners.
An hourly SLV shows a Flat-top Rule of 4 Breakout…on a gap.
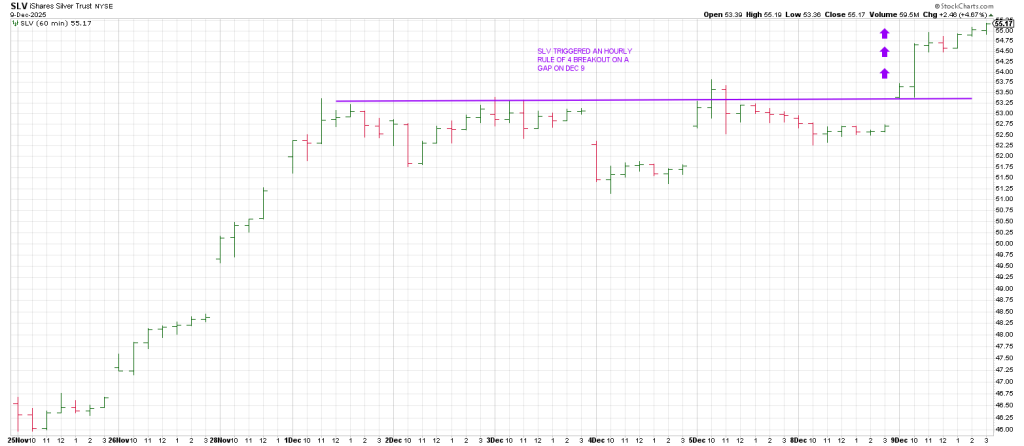
Pulling back the lens, shows SLV has headroom to the top of a trend channel in the 58 to 60 region.
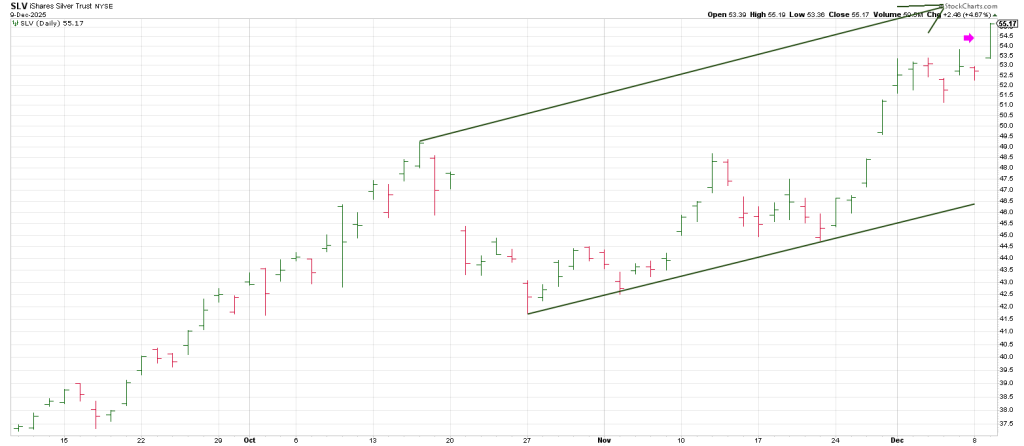
Silver should shine today again as December 10 squares out with 62 and silver closed at 60.80 on Tuesday. It should Gap & Go this morning.
Clearing and sustaining 62, silver should streak further.
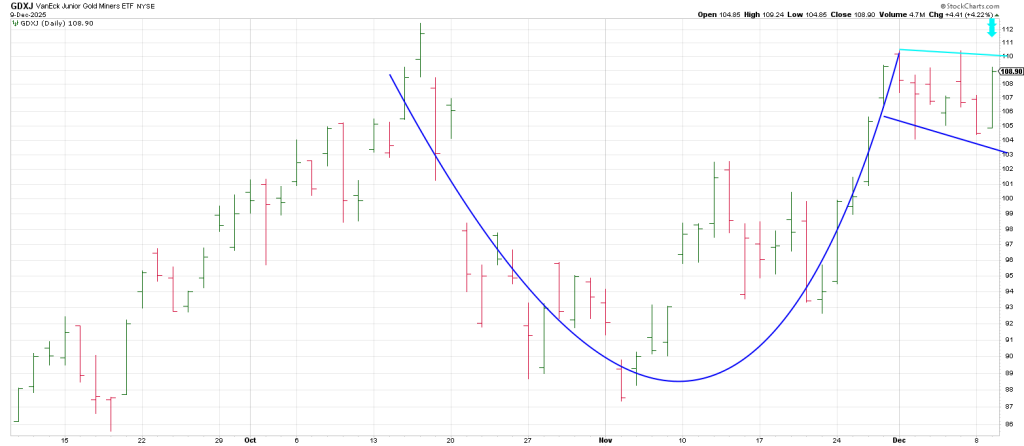
GDXJ has a well-defined Cup and Handle with Tuesday leaving a Bull Flag/180 buy continuation signal.
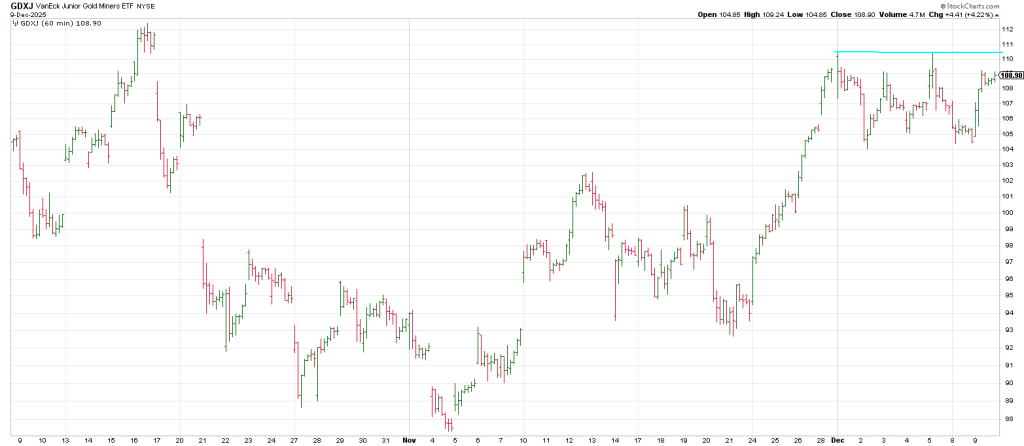
An hourly GDXJ shows a Rule of 4 Breakout on deck.
The levered ETF’s GDXU and AGQ followed suit with PM miners across the board such as WPM, PAAS, SII, GFI and AGI on fire.
The last chart I want to look at is IBIT, the bitcoin ETF.
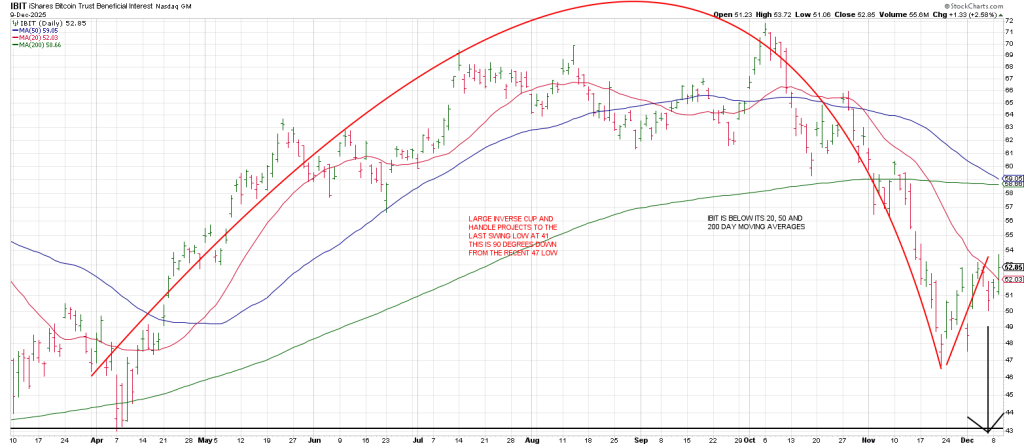
IBIT plunged to the 47 square on November 21 which is 270 degrees down from the 71/72 high on October 6.
The waterfall move is unlikely to end without a minimum 360 degree drop which targets 42.
A 540 degree cube out targets 29/30.
90 days/degrees from the October 6 high is January 6.
Following what looks like an A B C corrective rally since the November 21 low, IBIT should start a new leg down. It could begin at any time.
In addition to sporting a massive bearish inverse Cup and Handle, despite this current rebound, IBIT remains waterlogged below its 20, 50 and 200 moving averages…all which are pointing lower.
Bitcoin topped ahead of the SPX and led the break into late November.
The next leg down in bitcoin should coincide with SPX breakage below 6500.