“One of the important factors behind the fluctuation between bull and bear markets, between booms and crashes and bubbles, is that investor memory has to fail us—and fail universally—in order for the extremes to be reached.” Howard Marks
You’d better hurry up and choose which of those bills you want before they all disappear” The Ballad of Frankie lee and Judas Priest, Bob Dylan
Markets like to test. They like to test highs and lows before they trend in earnest.
Often those tests turn out to be pop quizzes for market participants who have not anticipated change in trend.
Markets turn on a dime, most traders cannot.
The SPX is at a different kind of test right now. It’s not testing a high or a low.
It’s testing what I call a Ghost Line. This is a line from the past that doesn’t look like it’s relevant any longer because price has moved away from it.
But the market has a long memory.
Below is a daily SPX from the major Oct 2023 low.
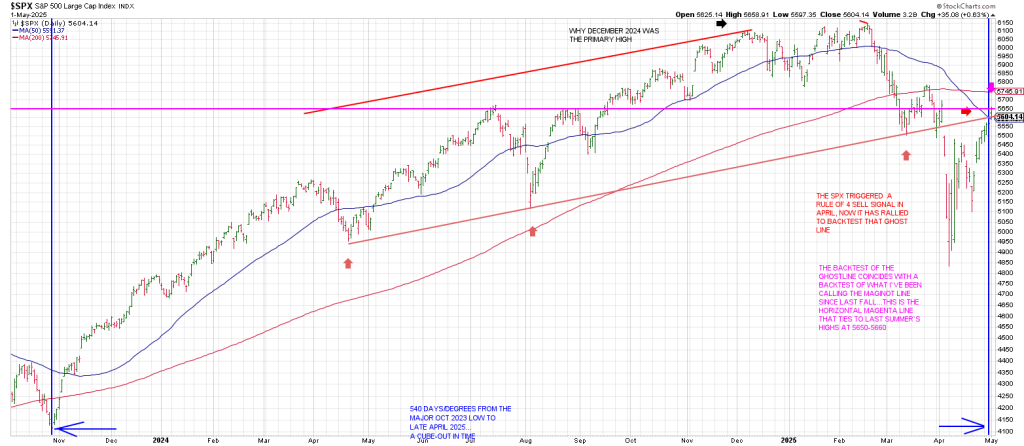
I connected the 3 most important pullbacks since the Oct 2023 low.
Those are the April 2024 pullback low.
The August 2024 pullback low and the March 2025 pullback low.
This is the light red line.
The SPX triggered a Rule of 4 Sell signal when it snapped those triple bottoms that define the Ghost Line.
Notice the initial break of the Ghost Line on March 31st that perpetuated a knee-jerk rally tracing out a Minus One/Plus Two sell setup over the next two days on April 2nd.
This is because the 3 Day Chart was pointing down and April 2nd satisfied two consecutive higher daily highs.
Then came the break of the Ghost Line in earnest. The second mouse got the cheese.
The second time thru the line got the Bear Cheese.
The pattern is very reminiscent of the 1929 crash on a much smaller scale.
It’s a fractal of the ’29 crash.
In 1929 there was a break of support and then a 1 or 2 day rally and then the bottom dropped out.
What is very similar is that both waterfall declines occurred into the Gann Panic Window of 49-55 days from a high.
Currently the SPX has rallied back up in what looks like a bearish Zig Zag or A B C counter-trend rally that BACKTESTS THE GHOSTLINE.
A is the rally into April 9-14.
B is the decline into April 21.
C is the rally into May 1st.
Notice that Thursday the SPX Pinocchio’d the red Ghost Line to kiss the horizontal magenta line.
The magenta line ties to the summer tops of 5650-5650.
Since last fall I’ve been calling that the Maginot Line saying that breakage below it would likely see a waterfall decline and may mark the end of the bull run.
This region also ties to a backtest of the declining widely watched 50 day line.
Most everyone is trying to figure out an Elliott count from the February high.
It ain’t easy.
However, from the Ghost Line I drew a parallel line that nails the December peak.
I think there’s a good case to be made that that is the Primary High…the end of momentum.
It’s clearly the case visually.
If you count the mid-December highs as the Primary High then Wave 1 down is the decline into January 13.
Wave 2 is the rally into the January/February highs.
Wave 3 down is the drop into March 13.
Wave 4 is the rally into March 25th and the plunge into April 7th becomes Wave 5 and the end of major Wave 1 down
If that is correct, then it follows that the rally since April 7 is an A B C big Wave 2.
If correct, a powerful Wave 3 decline is on deck.
How will we know if this count is correct?
1) This 5650-5660 region tested Thursday should mark resistance. Yesterday, the SPX tailed off from this test, sliding 40 points in the last 10 minutes.
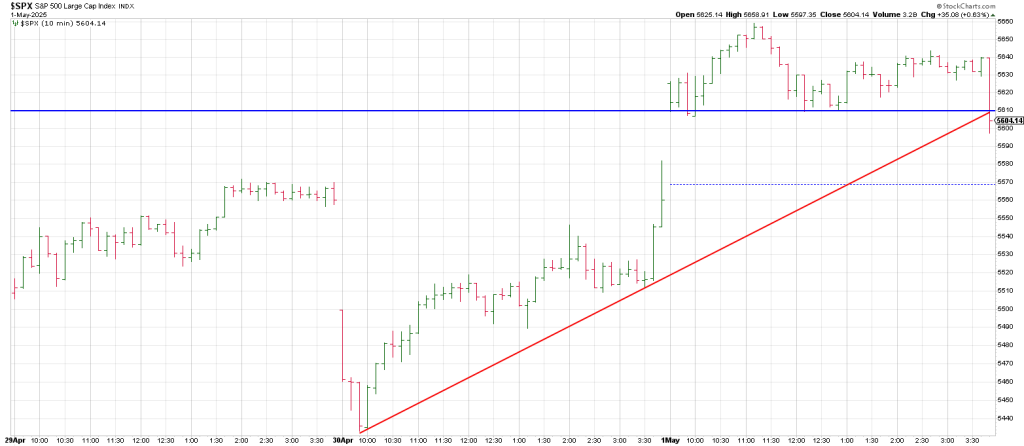
2) Failure below Wednesday’s low, that sticks, should confirm Wave C of 2, the Interim Top is in.
A failure back below Wednesday’s large range outside up day reversal will trigger a bearish Reversal of a Reversal or what I call a Keyser Soze.
There will be clues if Wednesday’s low is going to be broken: the SPX will offset yesterday’s gap and stay below it in synch with a move back below the 50 day moving average.
That will be the first sign of a crack in the rally.
Another downside pivot to watch is a 50% retrace of the advance since April 21st.
That pivot is 5380
The jobs report is scheduled to be released tomorrow an hour before the open.
Often times “bad news is good news” as to weak employment numbers because Wall Street likes to interpret that as a path for the Fed to ease.
However with the Fed voicing concern about inflation, they are on hold and bad news may be bad news.
Yesterday the SPX left an NR 7 Day (based on the range excluding the gap) with a Late Day ORB to the downside.
Was it a precursor to a sell day today?
The futures are right back up as I write tonight
Despite MSFT and META’s earning’s face rippers, both names struck Opening Spike Highs from resistance as suggested by yesterday’s charts.
After the bell yesterday, TEAM reported and sank 40 points.
AAPL reported shedding 7 points.
Yesterday’s Roadmap did a good job.
There was a rally high around 11:15.
Then a pullback into 12:45
Followed by a rally into 2:15. The projected rally into that time frame did not see a high for the day but these are
Time pivots.
From the 2:15 time a selloff into the bell was projected.
Today’s Roadmap suggests a decline after an opening rally attempt.
The rally attempt is brief, into 10:00 followed by a down draft into 11:30-12:00.
From there several rally attempts are reversed:
A rally into 12:30 with a sell-off into 1:30, another small rally attempt into 1:45
Is followed by a pullback into 2:15.
From there the Roadmap projects a rally in to 3:00 with another pullback into the close.
All in all a choppy trend day down is suggested.
It will be interesting to see how deep the decline into 11:30-12:00 is as today squares out with 555 (5550).