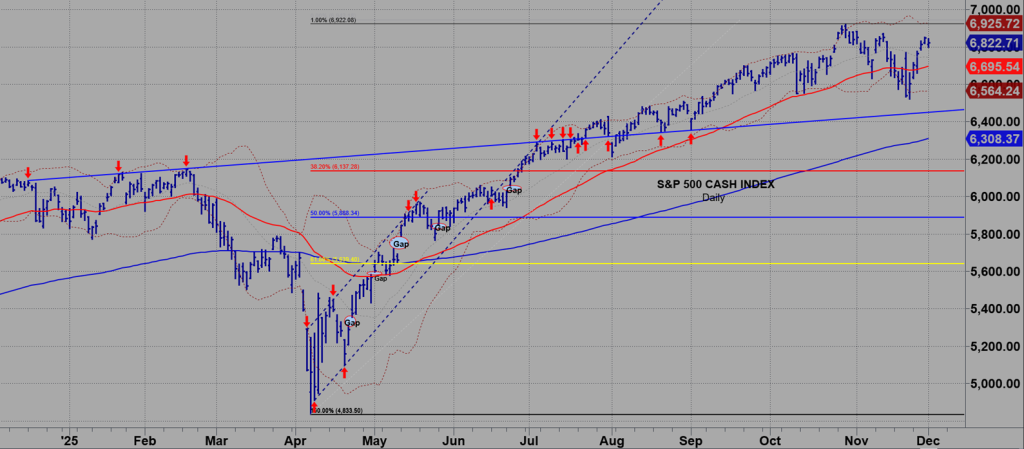
Above is a daily SPX for the last year.
The red arrows point to every point where price struck the solid blue line.
And there are a lot of points.
The more hits on a trend line, the more significant the line.
This is the story on the dotted blue trend line from the April low…just to prove the geometry.
The solid blue line has not been tagged for 3 months,
Notably it is below the last swing low from November 21.
Per yesterday’s report, November 21 low at 6521.92 represents the “circled” 3 Day Chart low as well as the ‘circled’ 3 Week Chart low.
When circled 3 Week Chart lows falter it is the Sign off the Bear.
When this circled 3 Week Chart low is broken it should open the door to a break off the solid Blue Trendline.
That will be a Point of Recognition for the markets whether investors and traders realize it or not.
It will open the door to the 200 DMA, the red horizontal line at 6180 region which is a Fibonacci .382 of the April-October advance.
Remarkably the advance is so steep and persistent that the 200 DMA is ABOVE 50% of the range.
50% of the advance is the 5900 region (horizontal blue line).
A .618 retrace of the advance ties to 5600.
There was an important double bottom on August 20/September 2.,,important because it underpinned the liftoff to the all-time October 29 high.
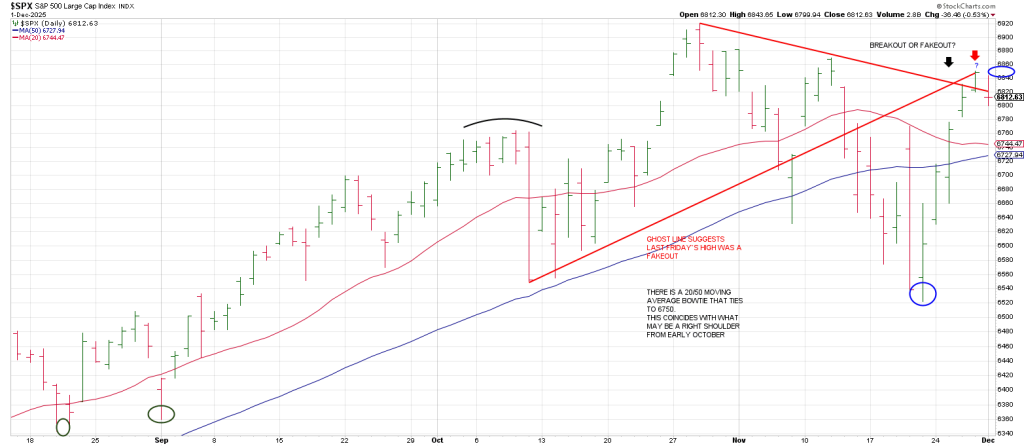
90 degrees/days from August 20 is the big November 20/21st low.
90 degree/days from September 2 is today.
Is it a low or a high?
Given we’ve exploded 329 points to last Friday’s high in 5 trading days it’s hard to imagine it’s a low.
If it’s a high it’s a false breakout. A false Rule of 4 Breakout.
Fast moves come from false move. In this case that should translate to a fast move to the downside.
That is consistent with the idea that the market has traced out a Secondary High.
Further, it underscores the potential for the Gann Panic Window.
The Gann Panic Window opens around 49 calendar days from a high. 7 squared days.
That points to December 7.
The Panic Window runs to the 55th/56th calendar day.
This ties to mid-December.
270 days/degrees back from X-mas was March 25, just prior to a 900 point plunge in 9 trading days.
We had a Christmas Crash 7 years ago in 2018.
It will be interesting to see if we get the traditional Santa Claus Rally to 7000 + that The Street is looking for or whether Gann’s “7 is the number of Panic” exerts its influence.
Which “7” will play out?
We know where the Line In the Sand is.