I’m trying to get this report out as quickly as possible because So Cal Edison is warning the power will go off again shortly due to high winds and fire conditions.
This report looks at the pattern that followed primary tops in the cycles from 1987, 2007, 2022, and 1929 compared to the current period since the early December 2024 peak.
The two things in the pattern I’m focusing on is the break of double bottoms below the 50 day moving average and the Gann Panic Zone…49 to 55 days from a peak.
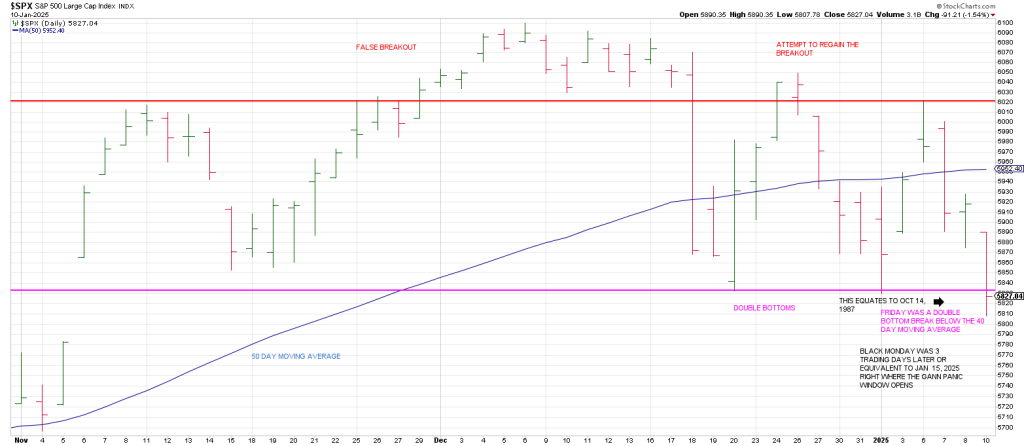
Below is a daily 1987
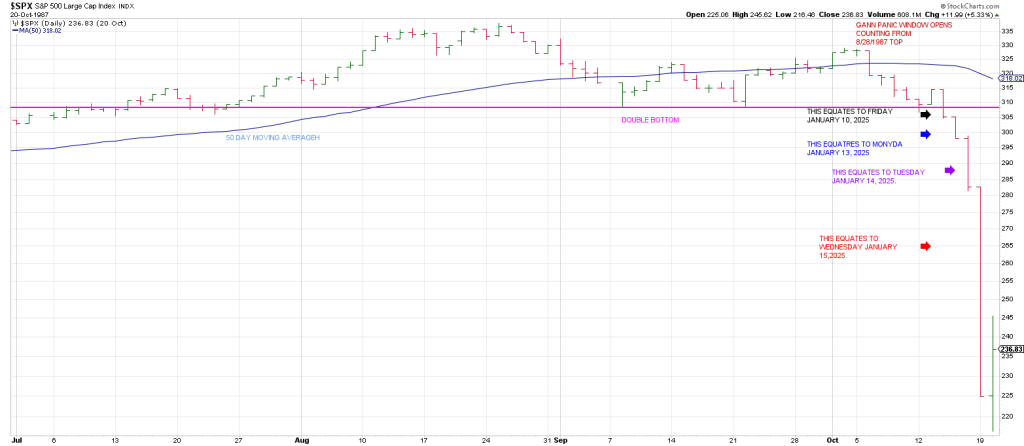
The magenta line defines the double bottom that occurred in September 1987 below the 50 day moving average.
The double bottom snapped on Wednesday, Oct 14, 1987.
Notice the rally the day before the double bottom broke.
On Thursday Oct 15, 1987 the market continued lower.
On Friday Oct 16th, the decline accelerated with a point of recognition.
On Black Monday, Oct 19th, 1987 the market collapsed.
Notice the failed attempt to recapture the 50 day moving average in early October.
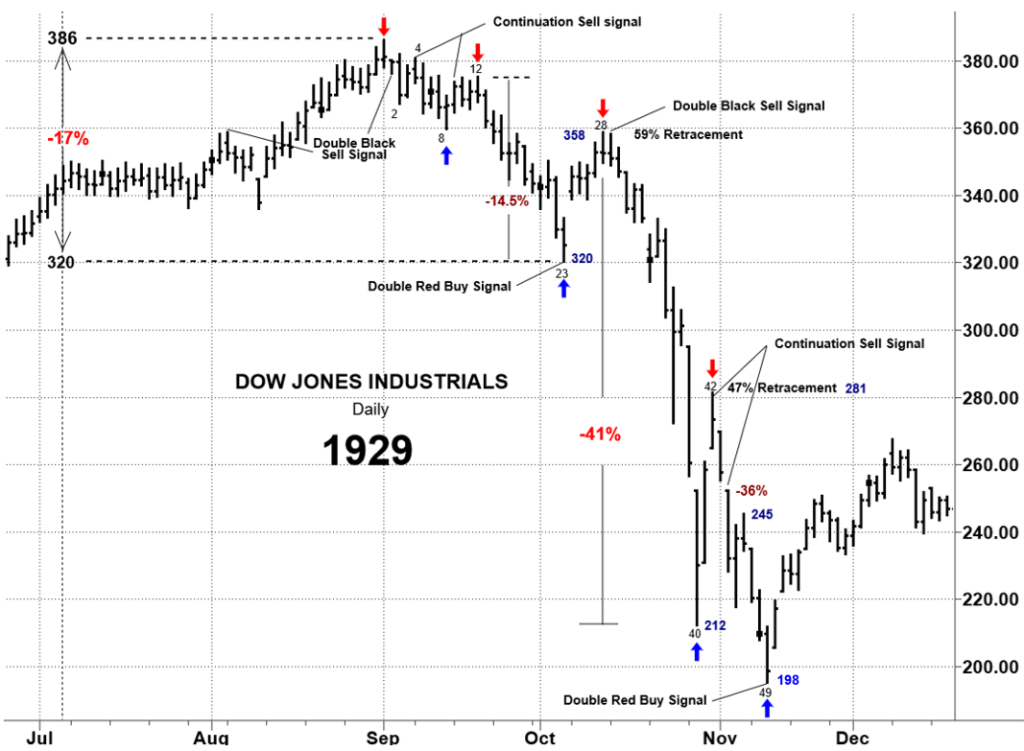
I remember September 1987 well. Most market participants assumed the “double bottom” was a consolidation that would perpetuate a new upleg, that the prior strength, in the summer would be revisited. But blow-offs are not revisited, they are unwound.
The top day in 1987 was August 25th. The Gann Panic Window opened 49 calendar days from there around September 4th where the SPX failed to reclaim its 50 day moving average.
In 1987 like 2025 the these two factors come together this week:
1) the break of the double bottom formed below the 50 DMA (Friday).
2) the Gann Panic Window opens.
Often one of these factors is ties to a downdraft.
The thesis is when both come together the wheels can come off.
Below is an SPX from the top in 2007.
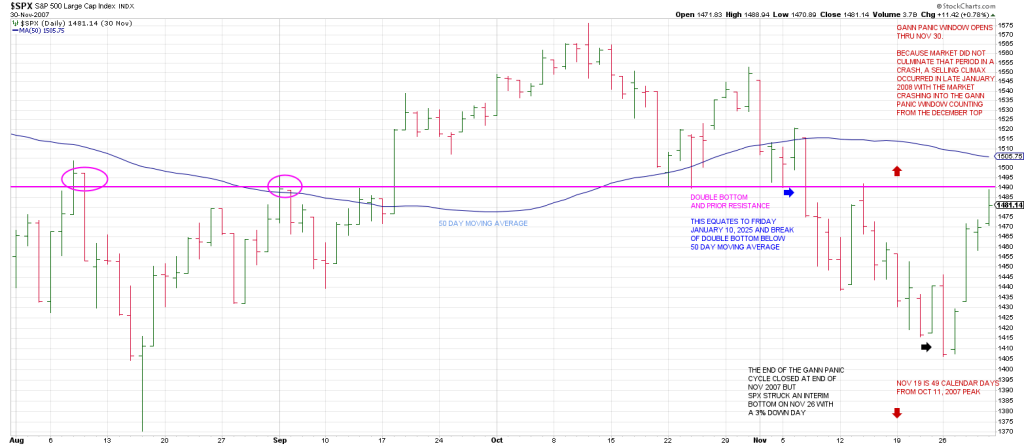
Notice the break of the double bottom in early November ties to the prior resistance.
Notice the rally day just before the break of the 50 DMA…just like Thursday January 8, 2025.
In 2007 the Gann Panic Window opened on November 19th (counting from the Oct 11 peak) and ran until November 30th.
However, the SPX bottom struck an interim low on November 26, four days before what is typically the selling climax which would tie to November 30.
Be that as it may the the November 19th interim low was a 3% down day.
Below is the pattern from the 2022 top.
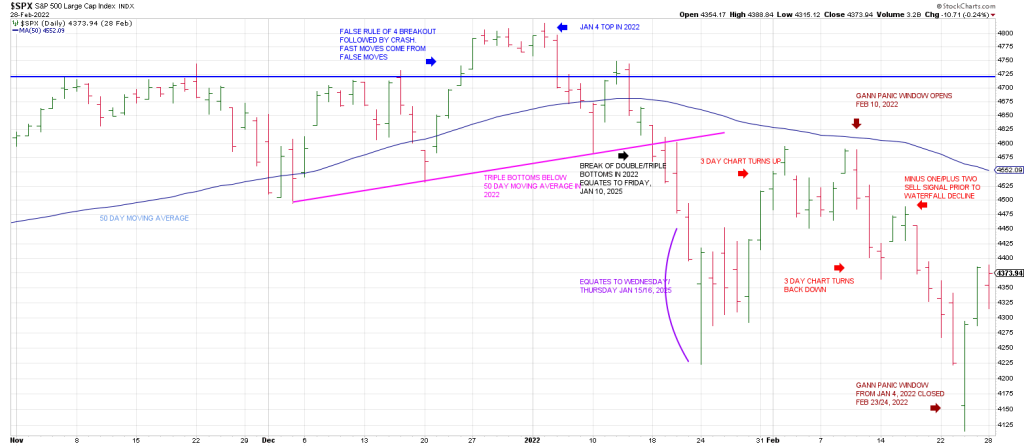
In this instance the SPX broke TRIPLE bottoms below the 50 day moving average.
The market waterfalled.
The break of the triple bottom equates to Friday, Jan 10, 2025 when the SPX broke a double bottom.
Again notice the rally day one day prior to the breakage below the double/triple bottom.
In this analog a waterfall decline erupts with a temporary selling climax occurring this Thursday, January 16.
Notice the large signal bar reversal day on January 24, 2022.
It was a large range Gilligan buy signal (a gap down to a new 60 day low with a close at/near session highs.
The reversal perpetuated a rally phase.
Market participants were buying the dip, perceiving that the prior momentous strength in 2021 would be revisited quickly.
The rally turned the important 3 Day Chart up, but when that turn up was tested the 3 Day Chart turned back down.
The SPX collapsed from a Minus One/Plus Two sell setup (the 3 Day Chart was pointing back down followed by 2 consecutive higher daily highs (+2)…precisely where the Gann Panic Window opens—49 calendar days from the Jan 4 peak.
Did Gann deliver? Yep.
The SPX slid from 4590 to 4116, roughly a 500 point drop or 10%+.
Of course the initial decline off the Jan 4, 2022 peak was 600 points or roughly 13%.
Currently the SPX is only off 5% from its Dec 6, 2024 peak.
A 10% drop equates to 5400.
That’s 400 points below Friday’s close.
Is that realistic?
Of course it is. A 10% correction is hardly unusual.
However it could happen quickly.
Panic could erupt as a Point Of Recognition sinks in.
That POR is that the support near the 50 day is not holding.
That POR is that the 200 day moving average was not tested at all last year.
Allow me to explain.
The 200 day moving average was not tested in all of 2017.
When 2018 kicked in the 200 DMA was tested violently in one fell swoop.
The 200 day moving average was not tested in all of 2021.
When 2022 kicked in the 200 DMA was tested violently in one fell swoop.
My expectation is the SPX 200 day moving will be tested this January…again as in 2018 and 2022.
The 200 DMA currently resides at 5576.
What do we know?
We know that 5640 is 540 degrees down from the 6100 peak.
557 (5570) is 180 degrees straight across and opposite January 23rd, the end of the Gann Panic Window.
Counting from the Jan 4, 2022 peak, the Gann Panic Window closed Feb 23/24. The SPX dropped hard into October 23/24.
Notice the echo of the January reversal bar from Jan 24.
Turning to the dailies for 2025 shows Friday’s breakage of a DOUBLE BOTTOM BELOW THE 50 DAY MOVING AVERAGE.
This is what I’m calling a Point Of Recognition.
Notice the failed attempt to recapture the 50 day moving average TWICE since late December.
Fast moves come from false moves.
The SPX staged a false breakout in late November.
In sum, Friday’s break of the double bottom below the 50 DMA in conjunction with this week’s Gann Panic Cycle warrants caution…just as it did in two severe downturns 1987 and 1929.