“Big wheel keep on turnin’” Proud Mary, John Fogerty
“Everything goes. I am working very hard at not thinking about how everything goes.” Joan Didion, Play It As It Lays
Play it as it lays is a poker term referring to a situation where a player’s hand is interpreted in multiple ways due to wild cards.
We certainly got a wild card on Monday.
How many of us expected the market to close in the green from the opening bell on Monday?
We’ve seen more than a few jokers in the deck to compliment the wild vol cards this year.
How about this for a joker in the deck: the daily MACD is now more overbought than at any time in the last 25 years…at the same time that retail at The Money Show in Florida are swinging from the rafters they’re so bullish.
The last time we were anywhere close was the high in Jan 2018.
A Flash Crash followed.
Could we get a new all-time high. Of course we could.
However if we do, The Matador will be stacking retail bodies for years
There are very few indicators if any that have “called” major highs or lows.
They can put you in the vicinity, but don’t expect them to ring a bell at the top (or bottom).
There is only one tool I know that points directly to tops and bottoms.
That is the Square of 9 Wheel.
It does so by integrating Time and Price.
As you have heard ad nauseam, “when time and price square-out expect a change in trend,” W.D. Gann.
The T Rex in the ointment, something Gann wanted you to figure out for yourselves, is that while all important highs and lows are square-outs and are harmonically related to other past (and future) highs and lows, not all square-outs are important highs and lows.
It’s a distinction with a difference. A very important difference.
How do we tell the difference between what looks like a genuine square-out and one the market is going to shrug off.
BEHAVIOR.
It is the behavior, the price action at a potential square-out that tells the tale of the tape.
The current configuration of the SPX is a great example.
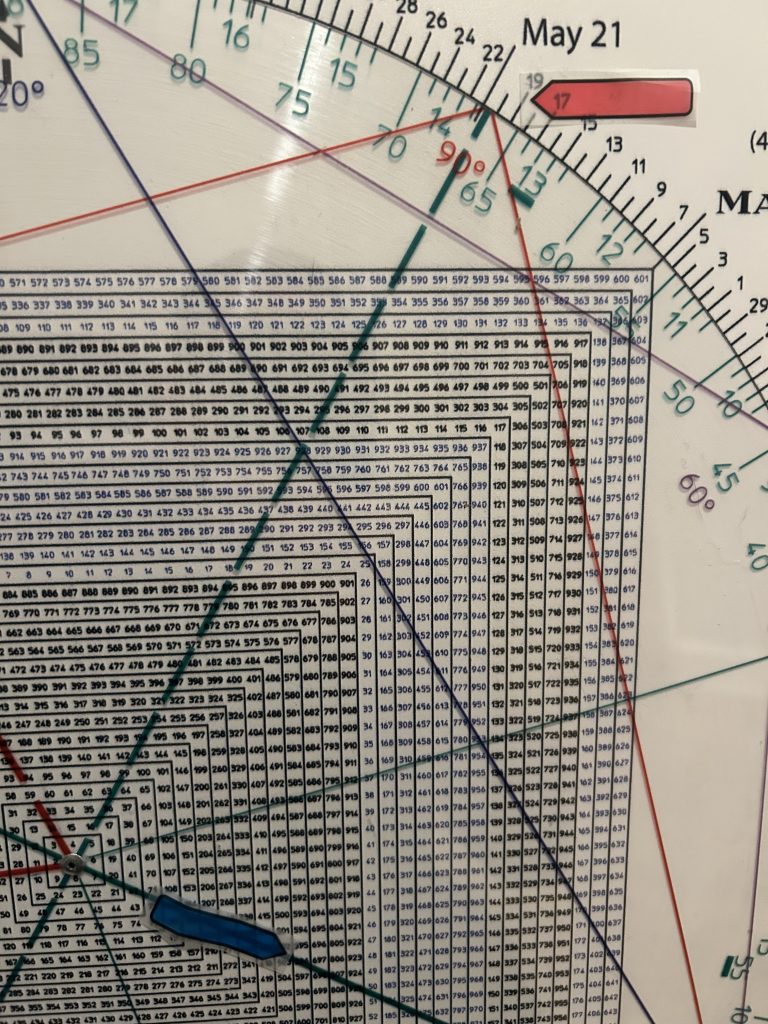
As you know 596 (5960) squares out with February 19, the day of the all-time high.
An important high because of what followed I think we can all agree.
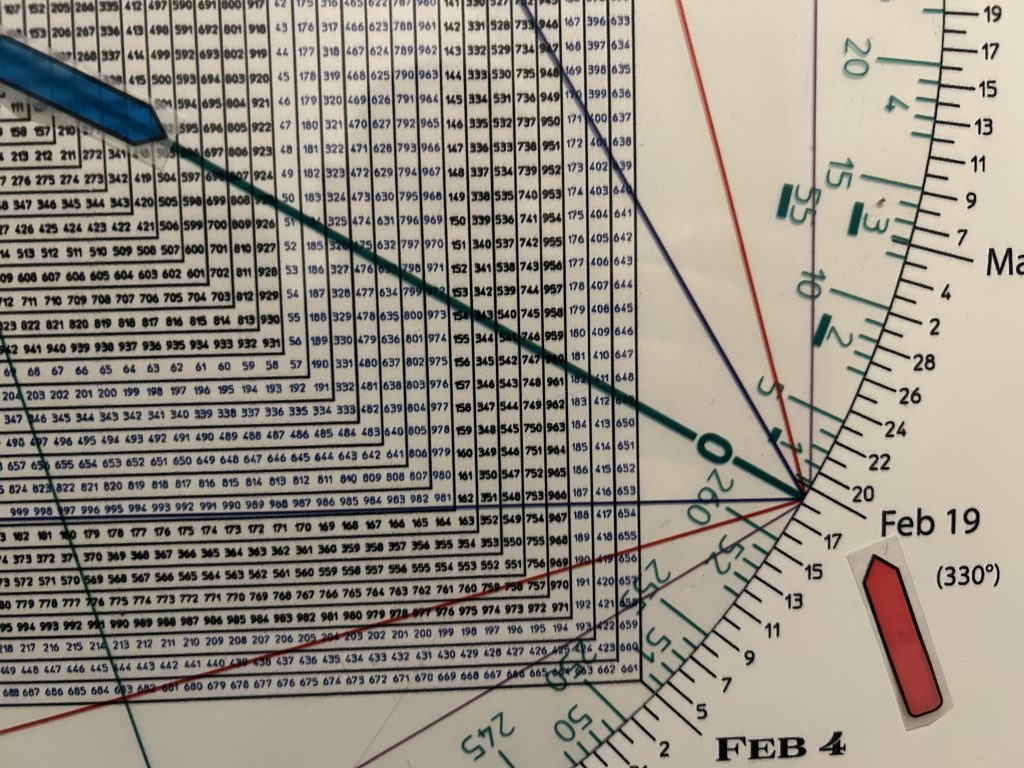
Friday I flagged that we have a double time/price square-out because May 19 also squares out with 596 as well are 90 days/degrees from February 19th.
Except that the year does not have 360 days/degrees, it has 365.
Hence, to be precise May 20/May 21st squares 596.
Why is identifying the top area of this rally so important?
It’s not just any rally.
Any intermediate top (if that’s what this turns out to be) implies risk is raging.
Allow me to explain.
The chart below tells us that we may have already struck a major top.
If that is the case then any top at this stage is a Secondary Top in the context of a major top.
But why am I looking for a major top in the first place?
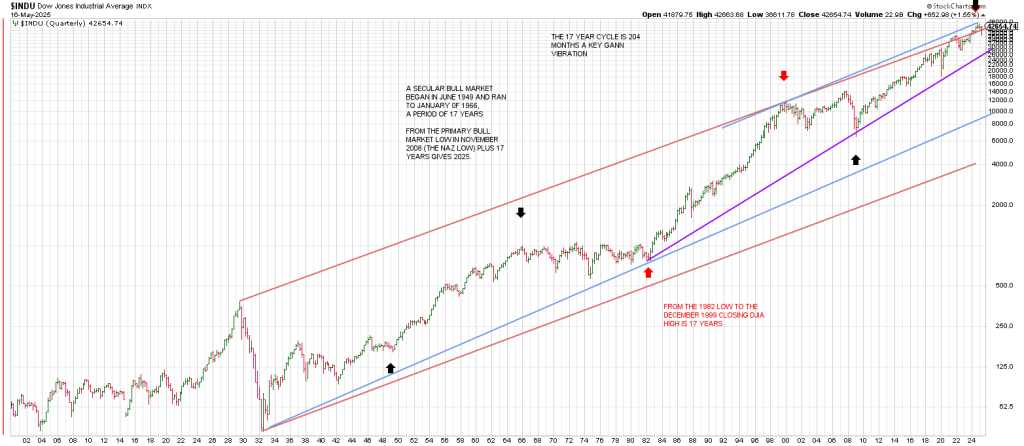
The first thing I want to point out is the 17 year cycle.
The DJIA started a secular bull market in June 1949 (first black arrow at the bottom).
The end of the secular bull market was in January 1966.
From the August 1982 bear market low (bottom red arrow) to the December 1999 monthly closing DJIA high (top red arrow) was also 17 years.
The Primary Low of the Great Financial Crisis was in November 2008 (second black bottom arrow. That is when the NAZ bottomed.
17 years later is 2025.
As we know there was a Secondary Low in the SPX in March 2009.
Could the SPX carve out a mirror image with a HIGHER Secondary High here in 2025?
But we could be making the Secondary High now.
As well if we count a 17 year cycle from March 2009 we get 2026.
The point is any top between 2025 and early 2026 is going to be a major top.
The trend channels from the 1929 high and the 1932 low agree with that assessment.
The upper red channel connects the 1929 peak with the 2000 top.
As you can see, the DJIA struck this upper red rail in late 2021/early 2022.
Then market respected the line with a 9 month sell-off.
The DJIA traced out a Return Rally into late 2024/early 2025 with a Pinocchio of the upper red rail.
The sharp sell-off after poking its head above the red channel is testimony to the authenticity of the trend line.
Interestingly the Pinocchio above the red trend line kissed the top of a blue trend channel.
The top blue rail is produced by a line from the 2000 top that is parallel a Bottoms Line connecting the 1932 with the 1982 low.
The purple trend line connects the 1982 low with the 2009 low and the 2020 low (+ or -).
Theoretically, breakage below the purple trend line opens the door to the bottom of the blue trend channel and fittingly a test of the 2008/2009 low.
Now what I want to show is the significance of the 17 year cycle.
Gann was a “cypher”. He pointed to the 17 year cycle in a cryptic fashion.
17 years is 204 months.
On the image of the Sq of 9 Wheel below, the number 204 vectors March 21.
The title of W.D. Gann’s coded novel is The Tunnel Thru The Air Or Looking Back From 1940.
If you look at the two numbers just above the pink arrow, you will see the numbers 19 and 40 side by side.
Looking back from the numbers 19 and 40 is the number 204.
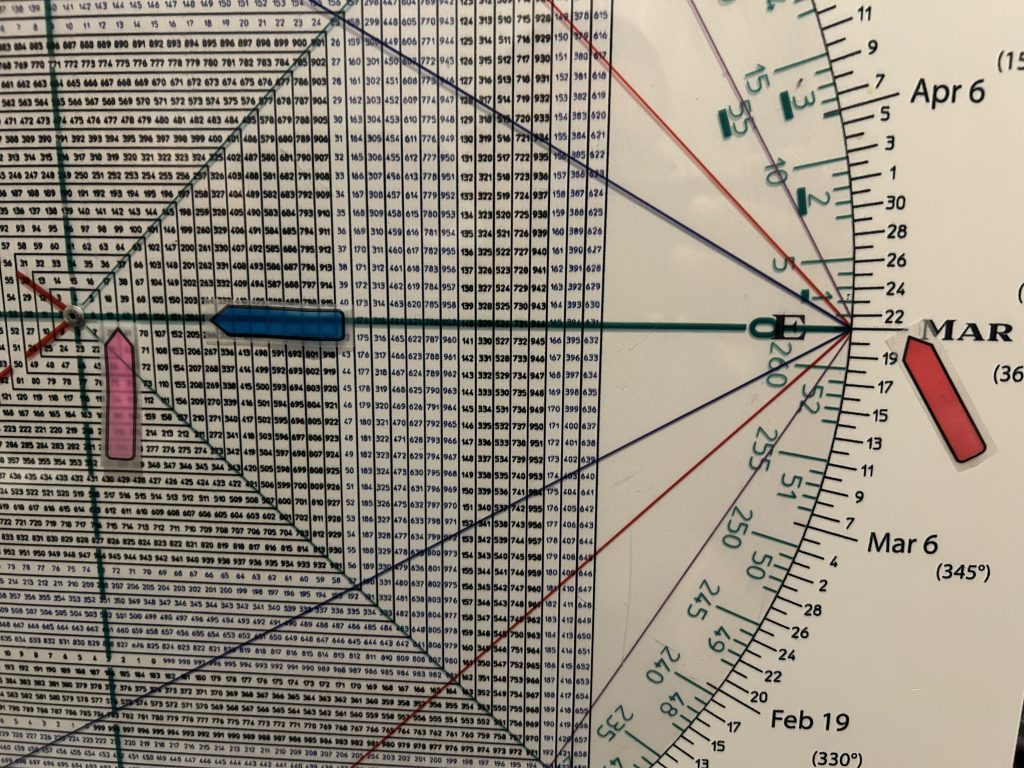
Also looking back from the numbers 19 and 40 is the number 69.
69 is the symbol for Cancer. Cancer is ruled by the Moon.
So if we multiply the 12 moonths in a year by the 17 year cycle we get 204.
Gann, he good.
Roadmap for May 20
The Roadmap is projecting a Trend Day down.
From an opening high it indicates a decline into 11:40
a small rally attempt plays out into 12:50 with a small pullback into 1:00 followed by another rally attempt into 2:00
a sharp sell off into the bell is seen