“Patterns are really the footprint of money” Fred McAllen
Below is a 10 min LITE
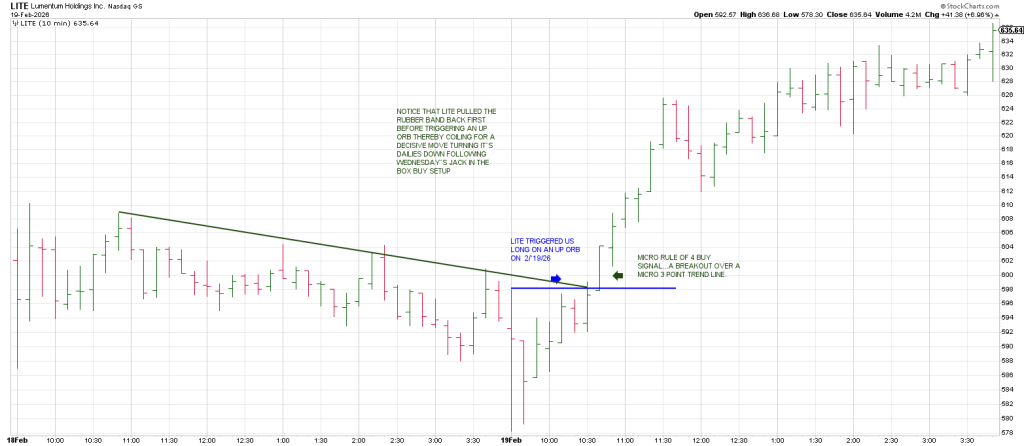
LITE triggered us long on an up ORB yesterday in tandem with a micro Rule of 4 Buy signal—a breakout over a 3 point trendline.
Notice that LITE pulled the rubber band back first before triggering an up ORB thereby coining for a decisive move after turning its dailies down following Wednesday’s Jack in the Box buy setup.
This is a bar with a down close inside a breakout bar….a Pause Day.
Here’s a daily LITE that shows Thursday’s 10 min Rule of 4 breakout was a fractal of the same pattern on the dailies.
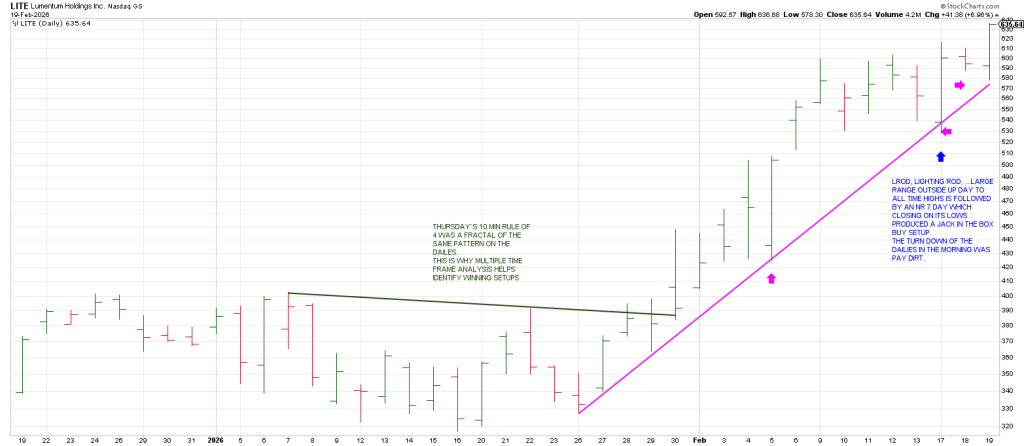
This is why multiple time frame analysis helps identify winning setups.
On Wednesday Hit and Run shorted VICR on the expectation that it would drop on earnings.
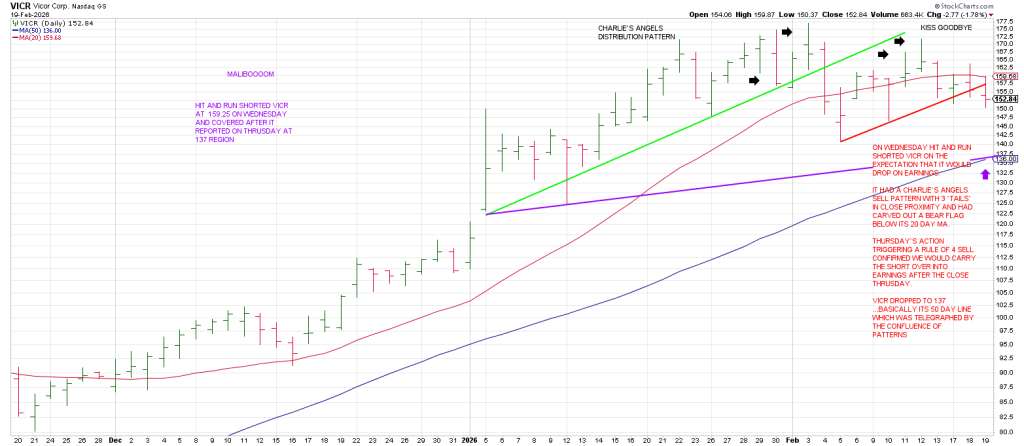
It had a Charlie’s Angels sell pattern with 3 ‘tails’ in close proximity and had carved out a Bear Flag below its 20 day ma.
Thursday’s action triggering a Rule of 4 Sell confirmed we would carry the short over into earnings after Thursday’s close.
VICR dropped to 137 after reporting, basically its 50 day line which was telegraphed by the confluence of patterns putting the pieces together.
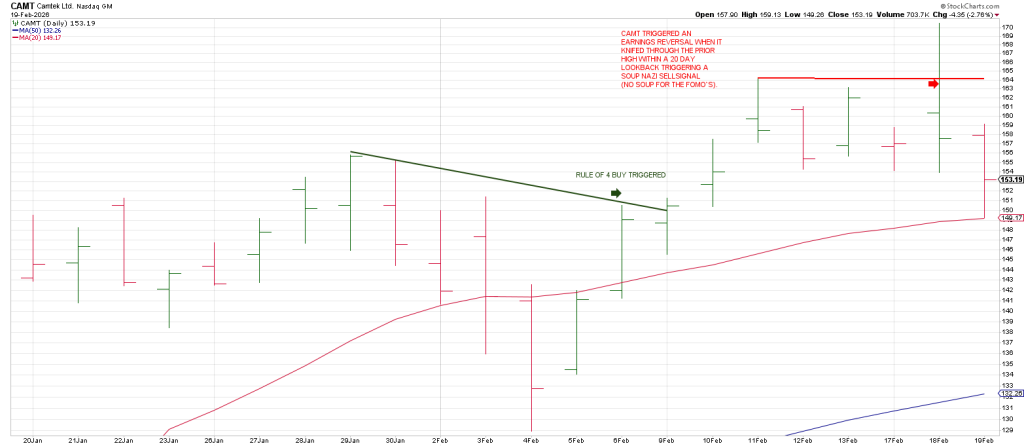
CAMT triggered an Earnings Reversal when it knifed through the prior high with a 20 day lookback triggering a Soup Nazi sell signal (no soup for the FOMO crowd).
Below is a daily KRMN.
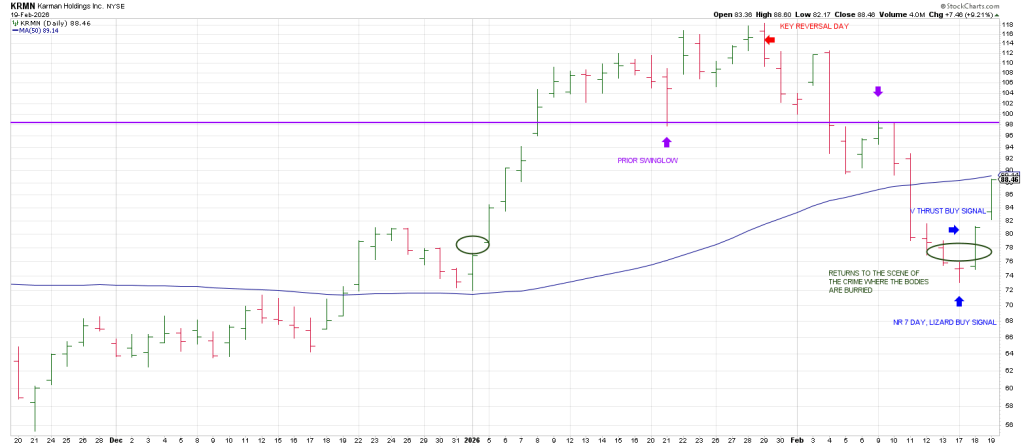
KRMN left a Key Reversal Day in late January leading to an authoritative breakoff its prior swing low perpetuating a return to the secen of the crime where the bodies are buried.
On Wednesday KRMN left an NR 7 Day (the narrowest range in 7 days. These contractions typically see expansions in range within two days).
A Lizard buy setup also defined the low day. This is a new 10 day low with an open and close hear session highs following a flush out.
Notice the expansion of range with KRMN shooting to its 50 day ma.
ORCL is a good example of a Sherlock’s Pipe pattern. A strategy I created to identify an base following an impulse.
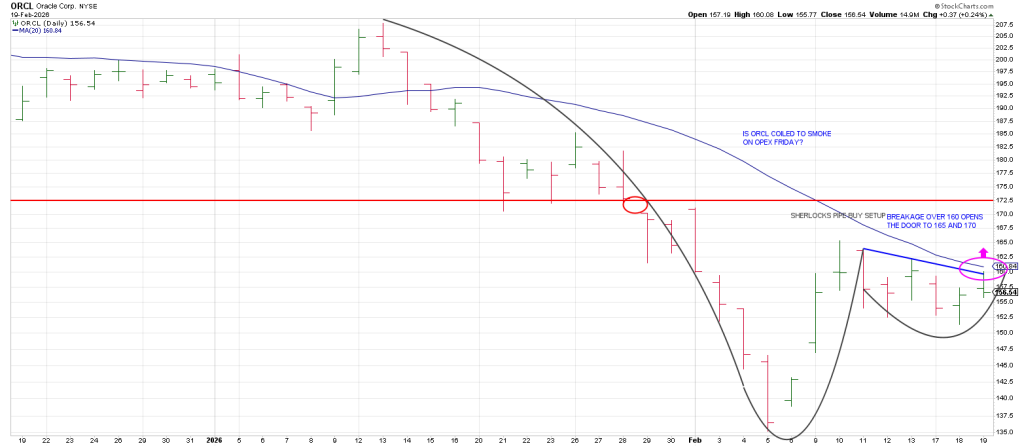
The pattern shows an initial impulse and a base.
The backing and filling frustrates players, but when the item “comes out” of the “bowl”, it smokes.
If ORCL clears 160 today, it could run to 165 on an OpEx Pinball setup.
Below is a daily STRL which had a stunning run in last week when it had an Over Throw of a Tops Line (orange) in tandem with a kiss of a secondary Tops Line (magenta).
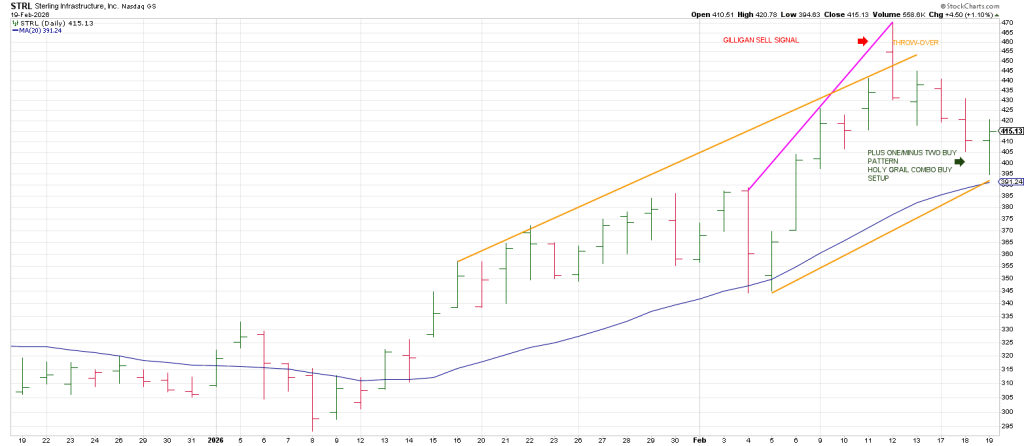
At Thursdays low it carved out 2 consecutive lower daily lows (Minus Two) within the context of the 3 Day Chart being up (Plus One) satisfying my Plus One/Minus Two Swing Method buy pattern.
At the same time STRL grazed its 20 day moving average for a Holy Grail buy setup for Friday.
Notice the high day carved out a Gilligan sell signal. This is a gap up to a new 60 day high with a close at/near sessionlows. I created this strategy to define exhaustions.
While these may be only temporary, it is uncanny how many times they define major swing highs.
HYMC is a long idea that we posted on the Hit and Run Private Twitter/X Feed on Thursday.
It shows a TNT long setup for Friday.
A TNT is an inside day following a large range impulse up.
So Thrust, Noise, Thrust (Friday ideally).
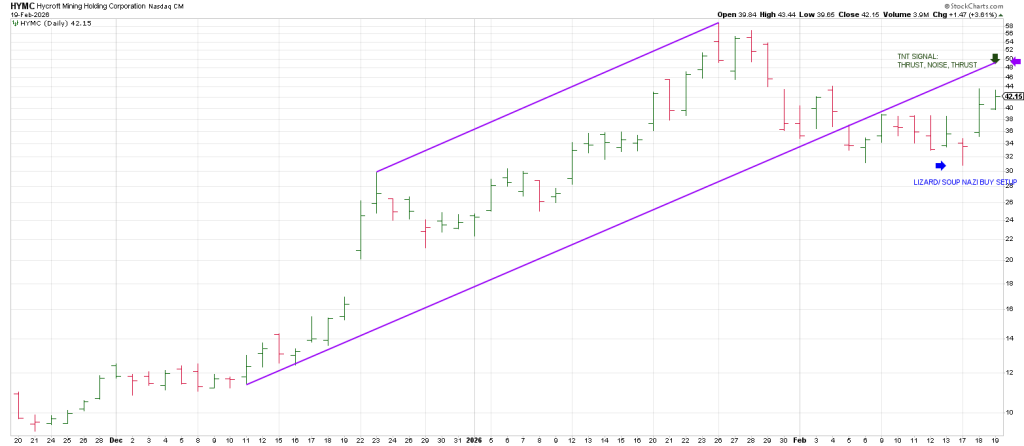
Notice how the low day on Tuesday left a Lizard buy setup—a new 10 day low with an open and close near the top of the range.
As well HYMC left a Soup Nazi buy signal on Tuesday as it undercut the low within a 20 day lookback but with at least a 4 day interval between lows).
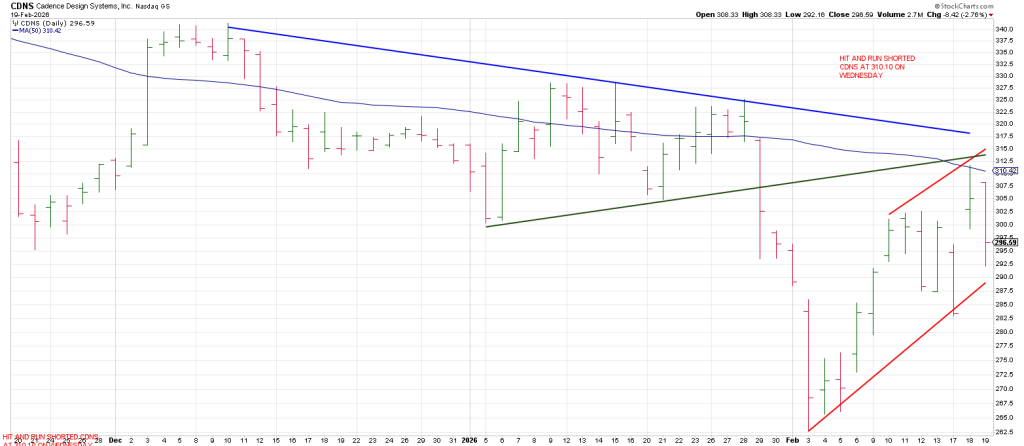
Hit and Run shorted CDNS (below) at 310.10 on Wednesday after it rallied to backtest its declining 50 day moving average in league with testing the top of a trend channel (red)
We covered as it dropped to Phil D Gap.
Patterns telegraph where stocks are going and when they fail, they are sounding an siren because fast moves come from false moves.
Why do patterns work? They are the manifestation of Time and Price, the Lennon and McCartney of trading.
Next week we are going to do a write-up exploring how patterns work.